Challenges and Opportunities for Innovation in the Public Works ...
Challenges and Opportunities for Innovation in the Public Works ...
Challenges and Opportunities for Innovation in the Public Works ...

You also want an ePaper? Increase the reach of your titles
YUMPU automatically turns print PDFs into web optimized ePapers that Google loves.
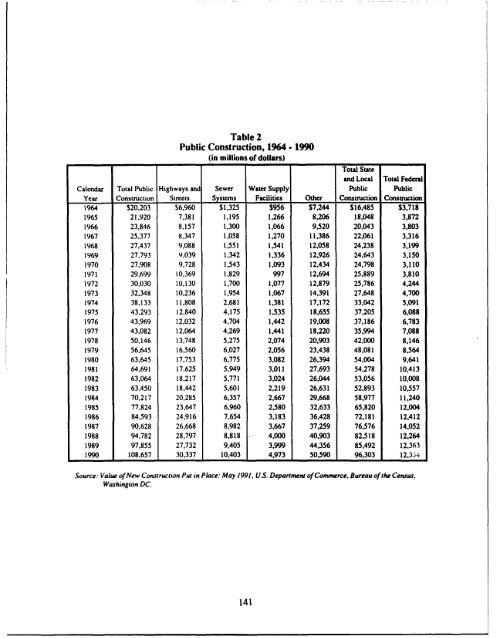
Table 2<br />
<strong>Public</strong> Construction, 1964 - 1990<br />
(<strong>in</strong> millions of dollars)<br />
Total State<br />
<strong>and</strong> Local Total Federal<br />
Calendar Total <strong>Public</strong> Highways <strong>and</strong> Sewer Water Supply <strong>Public</strong> <strong>Public</strong><br />
Year Construction Streets Systems Facilities O<strong>the</strong>r Construction Construction<br />
1964 S20.203 S6,960 $1,325 $956 $7.244 $16,485 $3,718<br />
1965 21.920 7.381 1,195 1.266 8.206 18.048 3,872<br />
1966 23,846 8,157 1,300 1,066 9,520 20,043 3.803<br />
1967 25,377 8,347 1,058 1,270 11,386 22,061 3,316<br />
1968 27.437 9,088 1.551 1.541 12.058 24,238 3.199<br />
1969 27.793 9.039 1,342 1,336 12,926 24.643 3,150<br />
1970 27.908 9.728 1.543 1,093 12,434 24,798 3.110<br />
1971 29.699 10.369 1.829 997 12,694 25.889 3,810<br />
1972 30,030 10,130 1,700 1,077 12,879 25,786 4,244<br />
1973 32,348 10.236 1,954 1,067 14,391 27,648 4,700<br />
1974 38,133 11.808 2.681 1.381 17,172 33.042 5,091<br />
1975 43.293 12.840 4,175 1,535 18,655 37.205 6,088<br />
1976 43.969 12.032 4,704 1,442 19,008 37,186 6.783<br />
1977 43,082 12.064 4,269 1,441 18,220 35,994 7,088<br />
1978 50,146 13.748 5.275 2,074 20,903 42,000 8,146<br />
1979 56.645 16.560 6,027 2,056 23,438 48,081 8,564<br />
1980 63,645 17.753 6,775 3,082 26.394 54,004 9,641<br />
1981 64,691 17,625 5,949 3,011 27,693 54.278 10,413<br />
1982 63,064 18,217 5,771 3,024 26,044 53.056 10,008<br />
1983 63,450 18.442 5,601 2,219 26,631 52,893 10,557<br />
1984 70.217 20.285 6,357 2,667 29,668 58,977 11,240<br />
1985 77,824 23.647 6.960 2,580 32,633 65,820 12,004<br />
1986 84.593 24.916 7.654 3.183 36,428 72,181 12,412<br />
1987 90,628 26.668 8,982 3,667 37,259 76.576 14,052<br />
1988 94.782 28.797 8,818 4,000 40,903 82,518 12,264<br />
1989 97.855 27.732 9,405 3,999 44,356 85.492 12,363<br />
1990 108,657 30.337 10,403 4,973 50,590 96,303 12,354<br />
Source: Value of New Construction Put <strong>in</strong> Place: May 1991. U.S. Deparitment of Commerce, Bureau of <strong>the</strong> Census,<br />
Wash<strong>in</strong>gton DC.<br />
141