Processus de Lévy en Finance - Laboratoire de Probabilités et ...
Processus de Lévy en Finance - Laboratoire de Probabilités et ...
Processus de Lévy en Finance - Laboratoire de Probabilités et ...

Create successful ePaper yourself
Turn your PDF publications into a flip-book with our unique Google optimized e-Paper software.
124 CHAPTER 3. NUMERICAL IMPLEMENTATION<br />
0.4<br />
0.38<br />
Variance gamma<br />
Calibrated with σ=0.25<br />
Calibrated with σ=0.2<br />
15<br />
True VG Levy measure<br />
Calibrated with σ=0.25<br />
Calibrated with σ=0.2<br />
0.36<br />
10<br />
0.34<br />
0.32<br />
5<br />
0.3<br />
0.28<br />
0.7 0.8 0.9 1 1.1 1.2 1.3 1.4<br />
0<br />
−0.5 0 0.5<br />
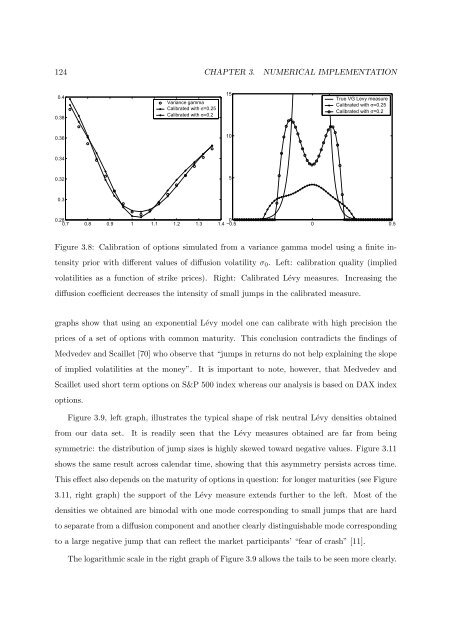
Figure 3.8: Calibration of options simulated from a variance gamma mo<strong>de</strong>l using a finite int<strong>en</strong>sity<br />
prior with differ<strong>en</strong>t values of diffusion volatility σ 0 . Left: calibration quality (implied<br />
volatilities as a function of strike prices). Right: Calibrated Lévy measures. Increasing the<br />
diffusion coeffici<strong>en</strong>t <strong>de</strong>creases the int<strong>en</strong>sity of small jumps in the calibrated measure.<br />
graphs show that using an expon<strong>en</strong>tial Lévy mo<strong>de</strong>l one can calibrate with high precision the<br />
prices of a s<strong>et</strong> of options with common maturity. This conclusion contradicts the findings of<br />
Medve<strong>de</strong>v and Scaill<strong>et</strong> [70] who observe that “jumps in r<strong>et</strong>urns do not help explaining the slope<br />
of implied volatilities at the money”. It is important to note, however, that Medve<strong>de</strong>v and<br />
Scaill<strong>et</strong> used short term options on S&P 500 in<strong>de</strong>x whereas our analysis is based on DAX in<strong>de</strong>x<br />
options.<br />
Figure 3.9, left graph, illustrates the typical shape of risk neutral Lévy <strong>de</strong>nsities obtained<br />
from our data s<strong>et</strong>. It is readily se<strong>en</strong> that the Lévy measures obtained are far from being<br />
symm<strong>et</strong>ric: the distribution of jump sizes is highly skewed toward negative values. Figure 3.11<br />
shows the same result across cal<strong>en</strong>dar time, showing that this asymm<strong>et</strong>ry persists across time.<br />
This effect also <strong>de</strong>p<strong>en</strong>ds on the maturity of options in question: for longer maturities (see Figure<br />
3.11, right graph) the support of the Lévy measure ext<strong>en</strong>ds further to the left. Most of the<br />
<strong>de</strong>nsities we obtained are bimodal with one mo<strong>de</strong> corresponding to small jumps that are hard<br />
to separate from a diffusion compon<strong>en</strong>t and another clearly distinguishable mo<strong>de</strong> corresponding<br />
to a large negative jump that can reflect the mark<strong>et</strong> participants’ “fear of crash” [11].<br />
The logarithmic scale in the right graph of Figure 3.9 allows the tails to be se<strong>en</strong> more clearly.