Processus de Lévy en Finance - Laboratoire de Probabilités et ...
Processus de Lévy en Finance - Laboratoire de Probabilités et ...
Processus de Lévy en Finance - Laboratoire de Probabilités et ...

Create successful ePaper yourself
Turn your PDF publications into a flip-book with our unique Google optimized e-Paper software.
184 CHAPTER 5. APPLICATIONS OF LEVY COPULAS<br />
0.04<br />
0.035<br />
Tail <strong>de</strong>p<strong>en</strong><strong>de</strong>nce<br />
No tail <strong>de</strong>p<strong>en</strong><strong>de</strong>nce<br />
0.04<br />
0.035<br />
Tail <strong>de</strong>p<strong>en</strong><strong>de</strong>nce<br />
No tail <strong>de</strong>p<strong>en</strong><strong>de</strong>nce<br />
0.03<br />
0.03<br />
0.025<br />
0.025<br />
0.02<br />
0.02<br />
0.015<br />
0.015<br />
0.01<br />
0.01<br />
0.005<br />
0.005<br />
0<br />
0.95 1 1.05<br />
0<br />
0.95 1 1.05<br />
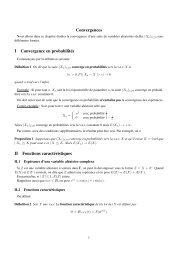
Figure 5.6: Prices of options on weighted average (left) and of best-of options (right) for two<br />
differ<strong>en</strong>t <strong>de</strong>p<strong>en</strong><strong>de</strong>nce patterns.<br />
Pattern 1 Strong tail <strong>de</strong>p<strong>en</strong><strong>de</strong>nce: θ = 10 and η = 0.75. The scatter plot of r<strong>et</strong>urns is shown<br />
in Figure 5.5, left graph. Although the signs of r<strong>et</strong>urns may be differ<strong>en</strong>t, the probability<br />
that the r<strong>et</strong>urns will be large in absolute value simultaneously in both compon<strong>en</strong>ts is very<br />
high.<br />
Pattern 2 Weak tail <strong>de</strong>p<strong>en</strong><strong>de</strong>nce: θ = 0.61 and η = 0.99. The scatter plot of r<strong>et</strong>urns in shown<br />
in Figure 5.5, right graph. With this <strong>de</strong>p<strong>en</strong><strong>de</strong>nce structure the r<strong>et</strong>urns typically have the<br />
same sign but their absolute values are not correlated.<br />
In each of the two cases, a sample of 1000 realizations of the couple (XT 1 , X2 T<br />
) with T = 0.02<br />
(one-week options) was simulated using the procedure <strong>de</strong>scribed in Example 5.3. The cutoff<br />
param<strong>et</strong>er τ (see Equation (5.14)) was tak<strong>en</strong> equal to 1000, which lead to limiting the average<br />
number of jumps for each trajectory to about 40. For this value of τ, Ui<br />
−1 (τ) is of or<strong>de</strong>r of<br />
10 −19 for both ass<strong>et</strong>s. Since for the variance gamma mo<strong>de</strong>l the converg<strong>en</strong>ce of U −1 to zero as<br />
τ → ∞ is expon<strong>en</strong>tial, the error resulting from the truncation of small jumps is of the same<br />
or<strong>de</strong>r, h<strong>en</strong>ce, negligible.<br />
Figure 5.6 shows the prices of bask<strong>et</strong> options, computed for differ<strong>en</strong>t strikes with <strong>de</strong>p<strong>en</strong><strong>de</strong>nce<br />
patterns giv<strong>en</strong> above. The initial ass<strong>et</strong> prices were S0 1 = S2 0 = 1, and the interest rate was tak<strong>en</strong><br />
to be r = 0.03. For the option on weighted average, the weights w i were both equal to 0.5<br />
and for the best-of option the coeffici<strong>en</strong>t was N = 1. The prices of European options, used for