Processus de Lévy en Finance - Laboratoire de Probabilités et ...
Processus de Lévy en Finance - Laboratoire de Probabilités et ...
Processus de Lévy en Finance - Laboratoire de Probabilités et ...

You also want an ePaper? Increase the reach of your titles
YUMPU automatically turns print PDFs into web optimized ePapers that Google loves.
2.2. SELECTION USING RELATIVE ENTROPY 69<br />
algorithm used for numerical optimization may stop in one of these local minima, leading to a<br />
much worse calibration quality than that of the true solution.<br />
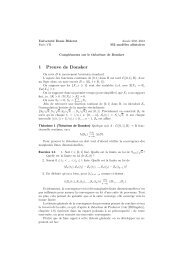
Figure 2.3 illustrates this effect in the (param<strong>et</strong>ric) framework of the variance gamma mo<strong>de</strong>l<br />
(1.18). The left graph shows the behavior of the calibration functional in a small region around<br />
the global minimum. Since in this mo<strong>de</strong>l there are only three param<strong>et</strong>ers, the i<strong>de</strong>ntification<br />
problem is not pres<strong>en</strong>t, and a nice profile appearing to be convex can be observed. However,<br />
wh<strong>en</strong> we look at the calibration functional on a larger scale (κ changes b<strong>et</strong>we<strong>en</strong> 1 and 8),<br />
the convexity disappears and we observe a ridge (highlighted with a dashed black line), which<br />
separates two regions: if the minimization is initiated in the region (A), the algorithm will<br />
ev<strong>en</strong>tually locate the minimum, but if we start in the region (B), the gradi<strong>en</strong>t <strong>de</strong>sc<strong>en</strong>t m<strong>et</strong>hod<br />
will lead us away from the global minimum and the required calibration quality will never be<br />
achieved.<br />
B<br />
15000<br />
x 10 5<br />
2<br />
1.8<br />
10000<br />
5000<br />
1.6<br />
1.4<br />
1.2<br />
1<br />
A<br />
0.8<br />
0.25<br />
0<br />
0.2<br />
0.15<br />
0.1<br />
0.05<br />
κ<br />
0<br />
min<br />
0.14<br />
0.16<br />
0.18<br />
σ<br />
0.2<br />
0.22<br />
0.24<br />
0.6<br />
8<br />
7<br />
6<br />
5<br />
4<br />
κ<br />
3<br />
2<br />
1<br />
0<br />
0.1<br />
0.15<br />
σ<br />
0.2<br />
Figure 2.3: Sum of squared differ<strong>en</strong>ces b<strong>et</strong>we<strong>en</strong> mark<strong>et</strong> prices (DAX options maturing in 10<br />
weeks) and mo<strong>de</strong>l prices in the variance gamma mo<strong>de</strong>l (1.18) as a function of σ and κ, the third<br />
param<strong>et</strong>er being fixed. Left: small region around the global minimum. Right: error surface on<br />
a larger scale.<br />
2.2 Selection of solutions using relative <strong>en</strong>tropy<br />
Wh<strong>en</strong> the option pricing constraints do not <strong>de</strong>termine the expon<strong>en</strong>tial Lévy mo<strong>de</strong>l compl<strong>et</strong>ely<br />
(this is for example the case if the number of constraints is finite), additional information may