- Page 1:
Migrant Smuggling in Asia Current T
- Page 4 and 5:
Printed: Bangkok, April 2015 Author
- Page 7 and 8:
Contents Foreword .................
- Page 9 and 10:
5.7 Organizational structure of mig
- Page 11:
39. Chinese nationals detected atte
- Page 14 and 15:
Migrant Smuggling in Asia Acknowled
- Page 16 and 17:
Migrant Smuggling in Asia Glossary
- Page 18 and 19:
Migrant Smuggling in Asia Executive
- Page 20 and 21:
VIII Migrant Smuggling in Asia
- Page 22 and 23:
Migrant Smuggling in Asia Smuggling
- Page 24 and 25:
Migrant Smuggling in Asia 1.5 Resea
- Page 26 and 27:
Migrant Smuggling in Asia Region E
- Page 28 and 29:
Migrant Smuggling in Asia Gulf coun
- Page 30 and 31:
Migrant Smuggling in Asia South-Eas
- Page 32 and 33:
Migrant Smuggling in Asia countrie
- Page 34 and 35:
Migrant Smuggling in Asia Table 9.
- Page 36 and 37:
Migrant Smuggling in Asia Table 13.
- Page 38 and 39:
Migrant Smuggling in Asia Turkey 3
- Page 40 and 41:
Migrant Smuggling in Asia Table 20.
- Page 42 and 43:
Migrant Smuggling in Asia Figure 2.
- Page 44 and 45:
Migrant Smuggling in Asia Figure 3.
- Page 46 and 47:
Migrant Smuggling in Asia For most
- Page 48 and 49:
Migrant Smuggling in Asia authoriti
- Page 50 and 51:
Migrant Smuggling in Asia For many
- Page 52 and 53:
Migrant Smuggling in Asia their smu
- Page 54 and 55:
Migrant Smuggling in Asia of Iran.
- Page 56 and 57:
Migrant Smuggling in Asia that a mi
- Page 58 and 59:
Migrant Smuggling in Asia Irregular
- Page 60 and 61:
Migrant Smuggling in Asia informati
- Page 62 and 63:
Migrant Smuggling in Asia Table 33.
- Page 64 and 65:
Migrant Smuggling in Asia to Europe
- Page 66 and 67:
Migrant Smuggling in Asia Figure 6.
- Page 68 and 69:
Migrant Smuggling in Asia and the e
- Page 70 and 71:
Migrant Smuggling in Asia The patte
- Page 72 and 73:
Migrant Smuggling in Asia a new tra
- Page 74 and 75:
Migrant Smuggling in Asia The group
- Page 76 and 77:
Migrant Smuggling in Asia of a migr
- Page 78 and 79:
Migrant Smuggling in Asia countries
- Page 80 and 81:
Migrant Smuggling in Asia 4.2 Push
- Page 82 and 83:
Migrant Smuggling in Asia are male,
- Page 84 and 85:
Migrant Smuggling in Asia licensed
- Page 86 and 87:
Migrant Smuggling in Asia Figure 9.
- Page 88 and 89:
Migrant Smuggling in Asia Figure 10
- Page 90 and 91:
Migrant Smuggling in Asia nationals
- Page 92 and 93:
Migrant Smuggling in Asia into East
- Page 94 and 95:
Migrant Smuggling in Asia 1 Jan.- 2
- Page 96 and 97:
Migrant Smuggling in Asia Republic
- Page 98 and 99:
Migrant Smuggling in Asia Figure 11
- Page 100 and 101:
Migrant Smuggling in Asia Figure 13
- Page 102 and 103:
Migrant Smuggling in Asia visas fro
- Page 104 and 105:
Migrant Smuggling in Asia Some chur
- Page 106 and 107:
Migrant Smuggling in Asia of better
- Page 108 and 109:
Migrant Smuggling in Asia react to
- Page 110 and 111:
Migrant Smuggling in Asia by boat f
- Page 112 and 113:
Migrant Smuggling in Asia the reali
- Page 114 and 115:
94 Migrant Smuggling in Asia
- Page 116 and 117:
Migrant Smuggling in Asia 7.2 Compl
- Page 118 and 119:
Migrant Smuggling in Asia step towa
- Page 120 and 121:
Migrant Smuggling in Asia Fiesole:
- Page 122 and 123:
Migrant Smuggling in Asia Frontex.
- Page 124 and 125:
Migrant Smuggling in Asia Practices
- Page 126 and 127:
Migrant Smuggling in Asia Masselink
- Page 128 and 129:
Migrant Smuggling in Asia Schloenha
- Page 130 and 131:
Migrant Smuggling in Asia United Na
- Page 132 and 133:
Migrant Smuggling in Asia Canada Bo
- Page 134 and 135:
Migrant Smuggling in Asia A. Triand
- Page 136 and 137:
Migrant Smuggling in Asia and K. La
- Page 138 and 139:
Migrant Smuggling in Asia Dutt, eds
- Page 140 and 141:
Migrant Smuggling in Asia 2012 (201
- Page 142 and 143:
Migrant Smuggling in Asia Human Tra
- Page 144 and 145:
Migrant Smuggling in Asia (2013), p
- Page 146 and 147:
Migrant Smuggling in Asia of migran
- Page 148 and 149:
Migrant Smuggling in Asia 146 Gover
- Page 150 and 151:
Migrant Smuggling in Asia Response
- Page 152 and 153:
Migrant Smuggling in Asia 192 A. Tr
- Page 154 and 155:
Migrant Smuggling in Asia Africa to
- Page 156 and 157:
Migrant Smuggling in Asia p. 9; Eur
- Page 158 and 159:
Migrant Smuggling in Asia Asia and
- Page 160 and 161:
Migrant Smuggling in Asia (2008), p
- Page 162 and 163:
Migrant Smuggling in Asia Punjab to
- Page 164 and 165:
Migrant Smuggling in Asia migration
- Page 166 and 167:
Migrant Smuggling in Asia 74 Asia F
- Page 168 and 169:
Migrant Smuggling in Asia 112 Gover
- Page 170 and 171:
Migrant Smuggling in Asia [restrict
- Page 172 and 173:
Migrant Smuggling in Asia Journal o
- Page 174 and 175:
Migrant Smuggling in Asia migrants
- Page 176 and 177:
Migrant Smuggling in Asia UNODC, Mi
- Page 178 and 179:
Migrant Smuggling in Asia Singapore
- Page 180 and 181:
Migrant Smuggling in Asia Assessing
- Page 182 and 183:
Migrant Smuggling in Asia ASEAN: Th
- Page 184 and 185:
Migrant Smuggling in Asia relating
- Page 186 and 187:
Migrant Smuggling in Asia York, Uni
- Page 188 and 189:
Migrant Smuggling in Asia Pacific r
- Page 190 and 191:
Migrant Smuggling in Asia in Asia (
- Page 192 and 193:
Migrant Smuggling in Asia emigratio
- Page 194 and 195:
Migrant Smuggling in Asia 53 R. Yam
- Page 196 and 197:
Migrant Smuggling in Asia 93 UNODC,
- Page 198 and 199:
178 Migrant Smuggling in Asia
- Page 200 and 201:
Migrant Smuggling in Asia Germany I
- Page 202 and 203:
Migrant Smuggling in Asia Total 19
- Page 204 and 205:
Migrant Smuggling in Asia Indonesia
- Page 206 and 207:
Migrant Smuggling in Asia Refugees
- Page 208 and 209:
Migrant Smuggling in Asia Country:
- Page 210 and 211:
Migrant Smuggling in Asia Total 3 4
- Page 212 and 213:
Migrant Smuggling in Asia Total 110
- Page 214 and 215:
Migrant Smuggling in Asia Mexico 22
- Page 216 and 217:
Migrant Smuggling in Asia Germany I
- Page 218 and 219:
Migrant Smuggling in Asia Finland 1
- Page 220 and 221:
Migrant Smuggling in Asia Table A1.
- Page 222 and 223:
Migrant Smuggling in Asia Russia 19
- Page 224 and 225:
Migrant Smuggling in Asia Italy Lat
- Page 226 and 227:
Migrant Smuggling in Asia Table A1.
- Page 228 and 229:
Migrant Smuggling in Asia Total 18
- Page 230 and 231:
Migrant Smuggling in Asia Kuwait 12
- Page 232 and 233:
Migrant Smuggling in Asia Table A1.
- Page 234 and 235:
Migrant Smuggling in Asia
- Page 236 and 237:
Migrant Smuggling in Asia
- Page 238 and 239:
Migrant Smuggling in Asia
- Page 240 and 241:
Migrant Smuggling in Asia
- Page 242 and 243:
Migrant Smuggling in Asia Total 10
- Page 244 and 245: Migrant Smuggling in Asia Table A2.
- Page 246 and 247: Migrant Smuggling in Asia Ukraine 8
- Page 248 and 249: Migrant Smuggling in Asia Country:
- Page 250 and 251: Migrant Smuggling in Asia TOTAL 3 6
- Page 252 and 253: Migrant Smuggling in Asia 2008 2009
- Page 254 and 255: Migrant Smuggling in Asia United Ki
- Page 256 and 257: Migrant Smuggling in Asia Table A2.
- Page 258 and 259: Migrant Smuggling in Asia Total 18
- Page 260 and 261: Migrant Smuggling in Asia Refugees
- Page 262 and 263: Migrant Smuggling in Asia 1 Jan.- 2
- Page 264 and 265: Migrant Smuggling in Asia Lithuania
- Page 266 and 267: Migrant Smuggling in Asia Refugees
- Page 268 and 269: Migrant Smuggling in Asia Table A1.
- Page 270 and 271: Migrant Smuggling in Asia Y
- Page 272 and 273: Migrant Smuggling in Asia Y Nepa
- Page 274 and 275: Migrant Smuggling in Asia Annex 3:
- Page 276 and 277: Migrant Smuggling in Asia Table A3.
- Page 278 and 279: Migrant Smuggling in Asia Indonesia
- Page 280 and 281: Migrant Smuggling in Asia Table A3.
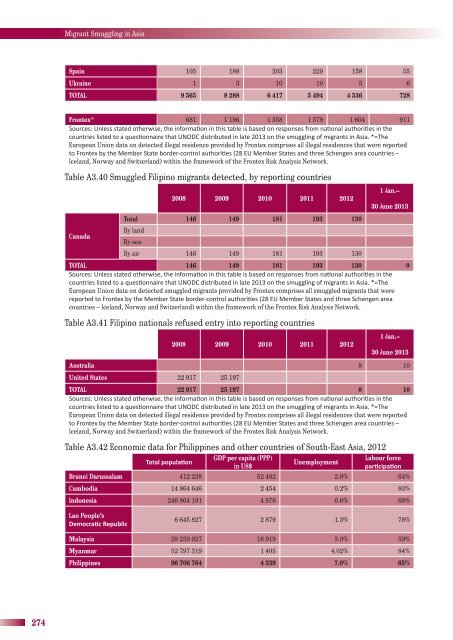
- Page 282 and 283: Migrant Smuggling in Asia Philippin
- Page 284 and 285: Migrant Smuggling in Asia Table A3.
- Page 286 and 287: Migrant Smuggling in Asia Europea
- Page 288 and 289: Migrant Smuggling in Asia Total 1 I
- Page 290 and 291: Migrant Smuggling in Asia Myanmar 5
- Page 292 and 293: Migrant Smuggling in Asia 2008 2009
- Page 296 and 297: Migrant Smuggling in Asia Refugees
- Page 298 and 299: Migrant Smuggling in Asia Table A3.
- Page 300 and 301: Migrant Smuggling in Asia United St
- Page 302 and 303: Migrant Smuggling in Asia Philippin
- Page 304 and 305: Migrant Smuggling in Asia Czech Rep
- Page 306 and 307: Migrant Smuggling in Asia Table A3.
- Page 308 and 309: Migrant Smuggling in Asia Refugees
- Page 310 and 311: Migrant Smuggling in Asia
- Page 312 and 313: Migrant Smuggling in Asia
- Page 314 and 315: Migrant Smuggling in Asia
- Page 316 and 317: Migrant Smuggling in Asia
- Page 318 and 319: Migrant Smuggling in Asia Annex 4:
- Page 320 and 321: Migrant Smuggling in Asia Refugees
- Page 322 and 323: Migrant Smuggling in Asia Country:
- Page 324 and 325: Migrant Smuggling in Asia Table A4.
- Page 326 and 327: Migrant Smuggling in Asia Indonesia
- Page 328 and 329: Migrant Smuggling in Asia Table A4.
- Page 330 and 331: Migrant Smuggling in Asia Estonia F
- Page 332 and 333: Migrant Smuggling in Asia Belgium 4
- Page 334 and 335: Migrant Smuggling in Asia Japan 127
- Page 336 and 337: Migrant Smuggling in Asia Country:
- Page 338 and 339: Migrant Smuggling in Asia Refugees
- Page 340 and 341: Migrant Smuggling in Asia