

Prospective crime mapping in operational context Final report
Prospective crime mapping in operational context Final report
Prospective crime mapping in operational context Final report
- No tags were found...

Create successful ePaper yourself
Turn your PDF publications into a flip-book with our unique Google optimized e-Paper software.
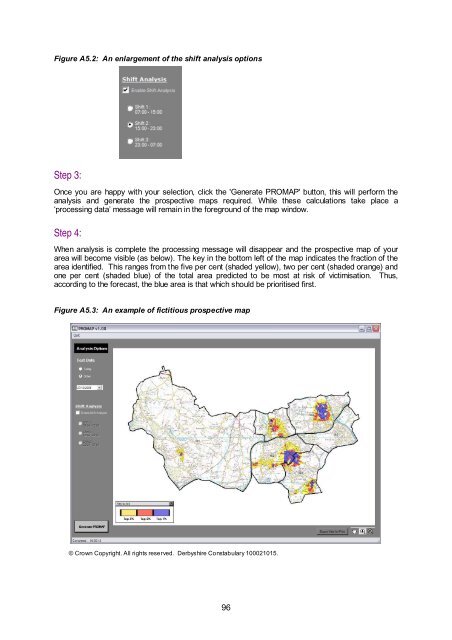
Figure A5.2: An enlargement of the shift analysis optionsStep 3:Once you are happy with your selection, click the 'Generate PROMAP' button, this will perform theanalysis and generate the prospective maps required. While these calculations take place a‘process<strong>in</strong>g data’ message will rema<strong>in</strong> <strong>in</strong> the foreground of the map w<strong>in</strong>dow.Step 4:When analysis is complete the process<strong>in</strong>g message will disappear and the prospective map of yourarea will become visible (as below). The key <strong>in</strong> the bottom left of the map <strong>in</strong>dicates the fraction of thearea identified. This ranges from the five per cent (shaded yellow), two per cent (shaded orange) andone per cent (shaded blue) of the total area predicted to be most at risk of victimisation. Thus,accord<strong>in</strong>g to the forecast, the blue area is that which should be prioritised first.Figure A5.3: An example of fictitious prospective map© Crown Copyright. All rights reserved. Derbyshire Constabulary 100021015.96


