

Prospective crime mapping in operational context Final report
Prospective crime mapping in operational context Final report
Prospective crime mapping in operational context Final report
- No tags were found...

You also want an ePaper? Increase the reach of your titles
YUMPU automatically turns print PDFs into web optimized ePapers that Google loves.
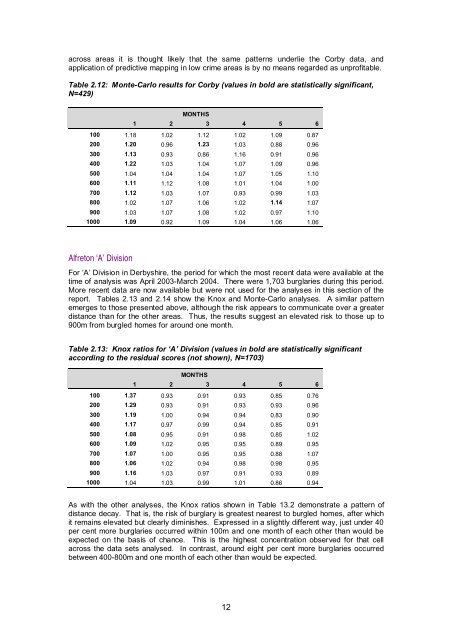
across areas it is thought likely that the same patterns underlie the Corby data, andapplication of predictive <strong>mapp<strong>in</strong>g</strong> <strong>in</strong> low <strong>crime</strong> areas is by no means regarded as unprofitable.Table 2.12: Monte-Carlo results for Corby (values <strong>in</strong> bold are statistically significant,N=429)MONTHS1 2 3 4 5 6100 1.18 1.02 1.12 1.02 1.09 0.87200 1.20 0.96 1.23 1.03 0.88 0.96300 1.13 0.93 0.86 1.16 0.91 0.96400 1.22 1.03 1.04 1.07 1.09 0.96500 1.04 1.04 1.04 1.07 1.05 1.10600 1.11 1.12 1.08 1.01 1.04 1.00700 1.12 1.03 1.07 0.93 0.99 1.03800 1.02 1.07 1.06 1.02 1.14 1.07900 1.03 1.07 1.08 1.02 0.97 1.101000 1.09 0.92 1.09 1.04 1.06 1.06Alfreton ‘A’ DivisionFor ‘A’ Division <strong>in</strong> Derbyshire, the period for which the most recent data were available at thetime of analysis was April 2003-March 2004. There were 1,703 burglaries dur<strong>in</strong>g this period.More recent data are now available but were not used for the analyses <strong>in</strong> this section of the<strong>report</strong>. Tables 2.13 and 2.14 show the Knox and Monte-Carlo analyses. A similar patternemerges to those presented above, although the risk appears to communicate over a greaterdistance than for the other areas. Thus, the results suggest an elevated risk to those up to900m from burgled homes for around one month.Table 2.13: Knox ratios for ‘A’ Division (values <strong>in</strong> bold are statistically significantaccord<strong>in</strong>g to the residual scores (not shown), N=1703)MONTHS1 2 3 4 5 6100 1.37 0.93 0.91 0.93 0.85 0.76200 1.29 0.93 0.91 0.93 0.93 0.96300 1.19 1.00 0.94 0.94 0.83 0.90400 1.17 0.97 0.99 0.94 0.85 0.91500 1.08 0.95 0.91 0.98 0.85 1.02600 1.09 1.02 0.95 0.95 0.89 0.95700 1.07 1.00 0.95 0.95 0.88 1.07800 1.06 1.02 0.94 0.98 0.98 0.95900 1.16 1.03 0.97 0.91 0.93 0.891000 1.04 1.03 0.99 1.01 0.86 0.94As with the other analyses, the Knox ratios shown <strong>in</strong> Table 13.2 demonstrate a pattern ofdistance decay. That is, the risk of burglary is greatest nearest to burgled homes, after whichit rema<strong>in</strong>s elevated but clearly dim<strong>in</strong>ishes. Expressed <strong>in</strong> a slightly different way, just under 40per cent more burglaries occurred with<strong>in</strong> 100m and one month of each other than would beexpected on the basis of chance. This is the highest concentration observed for that cellacross the data sets analysed. In contrast, around eight per cent more burglaries occurredbetween 400-800m and one month of each other than would be expected.12


