

Prospective crime mapping in operational context Final report
Prospective crime mapping in operational context Final report
Prospective crime mapping in operational context Final report
- No tags were found...

You also want an ePaper? Increase the reach of your titles
YUMPU automatically turns print PDFs into web optimized ePapers that Google loves.
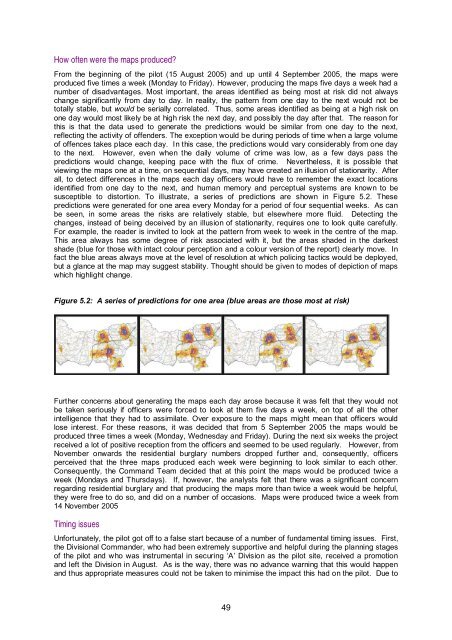
How often were the maps produced?From the beg<strong>in</strong>n<strong>in</strong>g of the pilot (15 August 2005) and up until 4 September 2005, the maps wereproduced five times a week (Monday to Friday). However, produc<strong>in</strong>g the maps five days a week had anumber of disadvantages. Most important, the areas identified as be<strong>in</strong>g most at risk did not alwayschange significantly from day to day. In reality, the pattern from one day to the next would not betotally stable, but would be serially correlated. Thus, some areas identified as be<strong>in</strong>g at a high risk onone day would most likely be at high risk the next day, and possibly the day after that. The reason forthis is that the data used to generate the predictions would be similar from one day to the next,reflect<strong>in</strong>g the activity of offenders. The exception would be dur<strong>in</strong>g periods of time when a large volumeof offences takes place each day. In this case, the predictions would vary considerably from one dayto the next. However, even when the daily volume of <strong>crime</strong> was low, as a few days pass thepredictions would change, keep<strong>in</strong>g pace with the flux of <strong>crime</strong>. Nevertheless, it is possible thatview<strong>in</strong>g the maps one at a time, on sequential days, may have created an illusion of stationarity. Afterall, to detect differences <strong>in</strong> the maps each day officers would have to remember the exact locationsidentified from one day to the next, and human memory and perceptual systems are known to besusceptible to distortion. To illustrate, a series of predictions are shown <strong>in</strong> Figure 5.2. Thesepredictions were generated for one area every Monday for a period of four sequential weeks. As canbe seen, <strong>in</strong> some areas the risks are relatively stable, but elsewhere more fluid. Detect<strong>in</strong>g thechanges, <strong>in</strong>stead of be<strong>in</strong>g deceived by an illusion of stationarity, requires one to look quite carefully.For example, the reader is <strong>in</strong>vited to look at the pattern from week to week <strong>in</strong> the centre of the map.This area always has some degree of risk associated with it, but the areas shaded <strong>in</strong> the darkestshade (blue for those with <strong>in</strong>tact colour perception and a colour version of the <strong>report</strong>) clearly move. Infact the blue areas always move at the level of resolution at which polic<strong>in</strong>g tactics would be deployed,but a glance at the map may suggest stability. Thought should be given to modes of depiction of mapswhich highlight change.Figure 5.2: A series of predictions for one area (blue areas are those most at risk)Further concerns about generat<strong>in</strong>g the maps each day arose because it was felt that they would notbe taken seriously if officers were forced to look at them five days a week, on top of all the other<strong>in</strong>telligence that they had to assimilate. Over exposure to the maps might mean that officers wouldlose <strong>in</strong>terest. For these reasons, it was decided that from 5 September 2005 the maps would beproduced three times a week (Monday, Wednesday and Friday). Dur<strong>in</strong>g the next six weeks the projectreceived a lot of positive reception from the officers and seemed to be used regularly. However, fromNovember onwards the residential burglary numbers dropped further and, consequently, officersperceived that the three maps produced each week were beg<strong>in</strong>n<strong>in</strong>g to look similar to each other.Consequently, the Command Team decided that at this po<strong>in</strong>t the maps would be produced twice aweek (Mondays and Thursdays). If, however, the analysts felt that there was a significant concernregard<strong>in</strong>g residential burglary and that produc<strong>in</strong>g the maps more than twice a week would be helpful,they were free to do so, and did on a number of occasions. Maps were produced twice a week from14 November 2005Tim<strong>in</strong>g issuesUnfortunately, the pilot got off to a false start because of a number of fundamental tim<strong>in</strong>g issues. First,the Divisional Commander, who had been extremely supportive and helpful dur<strong>in</strong>g the plann<strong>in</strong>g stagesof the pilot and who was <strong>in</strong>strumental <strong>in</strong> secur<strong>in</strong>g ‘A’ Division as the pilot site, received a promotionand left the Division <strong>in</strong> August. As is the way, there was no advance warn<strong>in</strong>g that this would happenand thus appropriate measures could not be taken to m<strong>in</strong>imise the impact this had on the pilot. Due to49


