

Prospective crime mapping in operational context Final report
Prospective crime mapping in operational context Final report
Prospective crime mapping in operational context Final report
- No tags were found...

You also want an ePaper? Increase the reach of your titles
YUMPU automatically turns print PDFs into web optimized ePapers that Google loves.
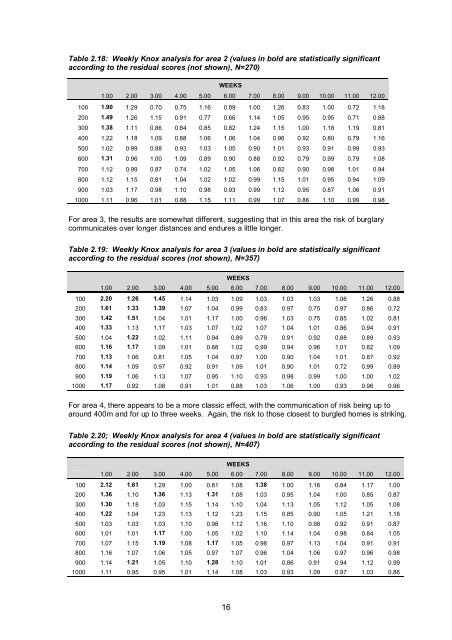
Table 2.18: Weekly Knox analysis for area 2 (values <strong>in</strong> bold are statistically significantaccord<strong>in</strong>g to the residual scores (not shown), N=270)WEEKS1.00 2.00 3.00 4.00 5.00 6.00 7.00 8.00 9.00 10.00 11.00 12.00100 1.90 1.29 0.70 0.75 1.16 0.89 1.00 1.26 0.83 1.00 0.72 1.18200 1.49 1.26 1.15 0.91 0.77 0.66 1.14 1.05 0.95 0.95 0.71 0.88300 1.38 1.11 0.86 0.84 0.85 0.82 1.24 1.15 1.00 1.18 1.19 0.81400 1.22 1.18 1.09 0.88 1.06 1.06 1.04 0.96 0.92 0.80 0.79 1.16500 1.02 0.99 0.88 0.93 1.03 1.05 0.90 1.01 0.93 0.91 0.99 0.93600 1.31 0.96 1.00 1.09 0.89 0.90 0.88 0.92 0.79 0.99 0.79 1.08700 1.12 0.99 0.87 0.74 1.02 1.05 1.06 0.82 0.90 0.98 1.01 0.94800 1.12 1.15 0.81 1.04 1.02 1.02 0.99 1.15 1.01 0.95 0.94 1.09900 1.03 1.17 0.98 1.10 0.98 0.93 0.99 1.12 0.95 0.87 1.06 0.911000 1.11 0.96 1.01 0.88 1.15 1.11 0.99 1.07 0.86 1.10 0.99 0.98For area 3, the results are somewhat different, suggest<strong>in</strong>g that <strong>in</strong> this area the risk of burglarycommunicates over longer distances and endures a little longer.Table 2.19: Weekly Knox analysis for area 3 (values <strong>in</strong> bold are statistically significantaccord<strong>in</strong>g to the residual scores (not shown), N=357)WEEKS1.00 2.00 3.00 4.00 5.00 6.00 7.00 8.00 9.00 10.00 11.00 12.00100 2.20 1.26 1.45 1.14 1.03 1.09 1.03 1.03 1.03 1.06 1.26 0.88200 1.61 1.33 1.39 1.07 1.04 0.99 0.83 0.97 0.75 0.97 0.86 0.72300 1.42 1.51 1.04 1.01 1.17 1.00 0.96 1.03 0.75 0.85 1.02 0.81400 1.33 1.13 1.17 1.03 1.07 1.02 1.07 1.04 1.01 0.86 0.94 0.91500 1.04 1.22 1.02 1.11 0.94 0.89 0.79 0.91 0.92 0.88 0.89 0.93600 1.16 1.17 1.09 1.01 0.88 1.02 0.99 0.94 0.96 1.01 0.82 1.09700 1.13 1.06 0.81 1.05 1.04 0.97 1.00 0.90 1.04 1.01 0.87 0.92800 1.14 1.09 0.97 0.92 0.91 1.09 1.01 0.90 1.01 0.72 0.99 0.89900 1.19 1.06 1.13 1.07 0.95 1.10 0.93 0.98 0.99 1.00 1.00 1.021000 1.17 0.92 1.08 0.91 1.01 0.88 1.03 1.06 1.00 0.93 0.96 0.96For area 4, there appears to be a more classic effect, with the communication of risk be<strong>in</strong>g up toaround 400m and for up to three weeks. Aga<strong>in</strong>, the risk to those closest to burgled homes is strik<strong>in</strong>g.Table 2.20; Weekly Knox analysis for area 4 (values <strong>in</strong> bold are statistically significantaccord<strong>in</strong>g to the residual scores (not shown), N=407)WEEKS1.00 2.00 3.00 4.00 5.00 6.00 7.00 8.00 9.00 10.00 11.00 12.00100 2.12 1.61 1.29 1.00 0.81 1.08 1.38 1.00 1.16 0.84 1.17 1.00200 1.36 1.10 1.36 1.13 1.31 1.08 1.03 0.95 1.04 1.00 0.85 0.87300 1.30 1.18 1.03 1.15 1.14 1.10 1.04 1.13 1.05 1.12 1.05 1.08400 1.22 1.04 1.23 1.13 1.12 1.23 1.15 0.85 0.90 1.05 1.21 1.16500 1.03 1.03 1.03 1.10 0.98 1.12 1.16 1.10 0.98 0.92 0.91 0.87600 1.01 1.01 1.17 1.00 1.05 1.02 1.10 1.14 1.04 0.98 0.84 1.05700 1.07 1.15 1.19 1.08 1.17 1.05 0.98 0.97 1.13 1.04 0.91 0.91800 1.16 1.07 1.06 1.05 0.97 1.07 0.96 1.04 1.06 0.97 0.96 0.98900 1.14 1.21 1.05 1.10 1.28 1.10 1.01 0.86 0.91 0.94 1.12 0.991000 1.11 0.95 0.95 1.01 1.14 1.08 1.03 0.93 1.09 0.97 1.03 0.8616


