

Prospective crime mapping in operational context Final report
Prospective crime mapping in operational context Final report
Prospective crime mapping in operational context Final report
- No tags were found...

You also want an ePaper? Increase the reach of your titles
YUMPU automatically turns print PDFs into web optimized ePapers that Google loves.
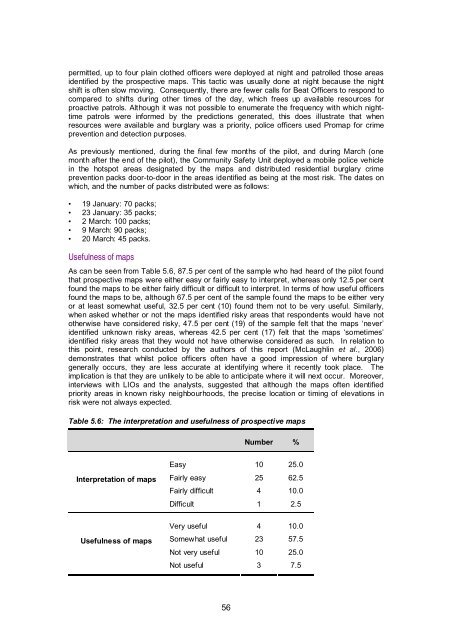
permitted, up to four pla<strong>in</strong> clothed officers were deployed at night and patrolled those areasidentified by the prospective maps. This tactic was usually done at night because the nightshift is often slow mov<strong>in</strong>g. Consequently, there are fewer calls for Beat Officers to respond tocompared to shifts dur<strong>in</strong>g other times of the day, which frees up available resources forproactive patrols. Although it was not possible to enumerate the frequency with which nighttimepatrols were <strong>in</strong>formed by the predictions generated, this does illustrate that whenresources were available and burglary was a priority, police officers used Promap for <strong>crime</strong>prevention and detection purposes.As previously mentioned, dur<strong>in</strong>g the f<strong>in</strong>al few months of the pilot, and dur<strong>in</strong>g March (onemonth after the end of the pilot), the Community Safety Unit deployed a mobile police vehicle<strong>in</strong> the hotspot areas designated by the maps and distributed residential burglary <strong>crime</strong>prevention packs door-to-door <strong>in</strong> the areas identified as be<strong>in</strong>g at the most risk. The dates onwhich, and the number of packs distributed were as follows:• 19 January: 70 packs;• 23 January: 35 packs;• 2 March: 100 packs;• 9 March: 90 packs;• 20 March: 45 packs.Usefulness of mapsAs can be seen from Table 5.6, 87.5 per cent of the sample who had heard of the pilot foundthat prospective maps were either easy or fairly easy to <strong>in</strong>terpret, whereas only 12.5 per centfound the maps to be either fairly difficult or difficult to <strong>in</strong>terpret. In terms of how useful officersfound the maps to be, although 67.5 per cent of the sample found the maps to be either veryor at least somewhat useful, 32.5 per cent (10) found them not to be very useful. Similarly,when asked whether or not the maps identified risky areas that respondents would have nototherwise have considered risky, 47.5 per cent (19) of the sample felt that the maps ‘never’identified unknown risky areas, whereas 42.5 per cent (17) felt that the maps ‘sometimes’identified risky areas that they would not have otherwise considered as such. In relation tothis po<strong>in</strong>t, research conducted by the authors of this <strong>report</strong> (McLaughl<strong>in</strong> et al., 2006)demonstrates that whilst police officers often have a good impression of where burglarygenerally occurs, they are less accurate at identify<strong>in</strong>g where it recently took place. Theimplication is that they are unlikely to be able to anticipate where it will next occur. Moreover,<strong>in</strong>terviews with LIOs and the analysts, suggested that although the maps often identifiedpriority areas <strong>in</strong> known risky neighbourhoods, the precise location or tim<strong>in</strong>g of elevations <strong>in</strong>risk were not always expected.Table 5.6: The <strong>in</strong>terpretation and usefulness of prospective mapsNumber %Interpretation of mapsEasy 10 25.0Fairly easy 25 62.5Fairly difficult 4 10.0Difficult 1 2.5Usefulness of mapsVery useful 4 10.0Somewhat useful 23 57.5Not very useful 10 25.0Not useful 3 7.556


