Prospective crime mapping in operational context Final report
Prospective crime mapping in operational context Final report
Prospective crime mapping in operational context Final report
- No tags were found...
Create successful ePaper yourself
Turn your PDF publications into a flip-book with our unique Google optimized e-Paper software.
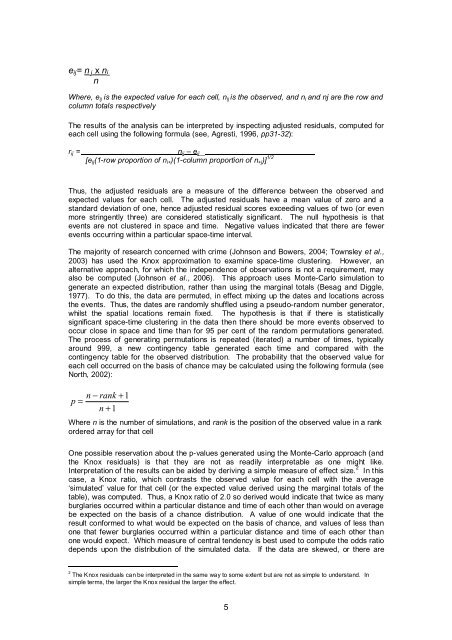
e ij = n .j x n i.nWhere, e ij is the expected value for each cell, n ij is the observed, and n i and nj are the row andcolumn totals respectivelyThe results of the analysis can be <strong>in</strong>terpreted by <strong>in</strong>spect<strong>in</strong>g adjusted residuals, computed foreach cell us<strong>in</strong>g the follow<strong>in</strong>g formula (see, Agresti, 1996, pp31-32):r ij =n ij – e ij[e ij (1-row proportion of n i+ )(1-column proportion of n +j )] 1/2Thus, the adjusted residuals are a measure of the difference between the observed andexpected values for each cell. The adjusted residuals have a mean value of zero and astandard deviation of one, hence adjusted residual scores exceed<strong>in</strong>g values of two (or evenmore str<strong>in</strong>gently three) are considered statistically significant. The null hypothesis is thatevents are not clustered <strong>in</strong> space and time. Negative values <strong>in</strong>dicated that there are fewerevents occurr<strong>in</strong>g with<strong>in</strong> a particular space-time <strong>in</strong>terval.The majority of research concerned with <strong>crime</strong> (Johnson and Bowers, 2004; Townsley et al.,2003) has used the Knox approximation to exam<strong>in</strong>e space-time cluster<strong>in</strong>g. However, analternative approach, for which the <strong>in</strong>dependence of observations is not a requirement, mayalso be computed (Johnson et al., 2006). This approach uses Monte-Carlo simulation togenerate an expected distribution, rather than us<strong>in</strong>g the marg<strong>in</strong>al totals (Besag and Diggle,1977). To do this, the data are permuted, <strong>in</strong> effect mix<strong>in</strong>g up the dates and locations acrossthe events. Thus, the dates are randomly shuffled us<strong>in</strong>g a pseudo-random number generator,whilst the spatial locations rema<strong>in</strong> fixed. The hypothesis is that if there is statisticallysignificant space-time cluster<strong>in</strong>g <strong>in</strong> the data then there should be more events observed tooccur close <strong>in</strong> space and time than for 95 per cent of the random permutations generated.The process of generat<strong>in</strong>g permutations is repeated (iterated) a number of times, typicallyaround 999, a new cont<strong>in</strong>gency table generated each time and compared with thecont<strong>in</strong>gency table for the observed distribution. The probability that the observed value foreach cell occurred on the basis of chance may be calculated us<strong>in</strong>g the follow<strong>in</strong>g formula (seeNorth, 2002):n − rank + 1p =n + 1Where n is the number of simulations, and rank is the position of the observed value <strong>in</strong> a rankordered array for that cellOne possible reservation about the p-values generated us<strong>in</strong>g the Monte-Carlo approach (andthe Knox residuals) is that they are not as readily <strong>in</strong>terpretable as one might like.Interpretation of the results can be aided by deriv<strong>in</strong>g a simple measure of effect size. 2 In thiscase, a Knox ratio, which contrasts the observed value for each cell with the average‘simulated’ value for that cell (or the expected value derived us<strong>in</strong>g the marg<strong>in</strong>al totals of thetable), was computed. Thus, a Knox ratio of 2.0 so derived would <strong>in</strong>dicate that twice as manyburglaries occurred with<strong>in</strong> a particular distance and time of each other than would on averagebe expected on the basis of a chance distribution. A value of one would <strong>in</strong>dicate that theresult conformed to what would be expected on the basis of chance, and values of less thanone that fewer burglaries occurred with<strong>in</strong> a particular distance and time of each other thanone would expect. Which measure of central tendency is best used to compute the odds ratiodepends upon the distribution of the simulated data. If the data are skewed, or there are2 The Knox residuals can be <strong>in</strong>terpreted <strong>in</strong> the same way to some extent but are not as simple to understand. Insimple terms, the larger the Knox residual the larger the effect.5


