

Prospective crime mapping in operational context Final report
Prospective crime mapping in operational context Final report
Prospective crime mapping in operational context Final report
- No tags were found...

You also want an ePaper? Increase the reach of your titles
YUMPU automatically turns print PDFs into web optimized ePapers that Google loves.
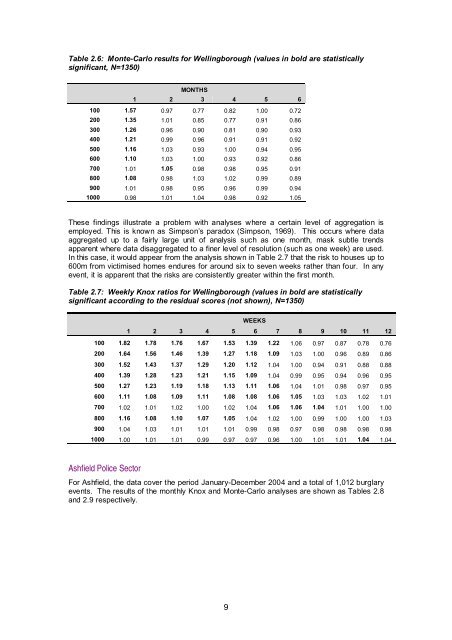
Table 2.6: Monte-Carlo results for Well<strong>in</strong>gborough (values <strong>in</strong> bold are statisticallysignificant, N=1350)MONTHS1 2 3 4 5 6100 1.57 0.97 0.77 0.82 1.00 0.72200 1.35 1.01 0.85 0.77 0.91 0.86300 1.26 0.96 0.90 0.81 0.90 0.93400 1.21 0.99 0.96 0.91 0.91 0.92500 1.16 1.03 0.93 1.00 0.94 0.95600 1.10 1.03 1.00 0.93 0.92 0.86700 1.01 1.05 0.98 0.98 0.95 0.91800 1.08 0.98 1.03 1.02 0.99 0.89900 1.01 0.98 0.95 0.96 0.99 0.941000 0.98 1.01 1.04 0.98 0.92 1.05These f<strong>in</strong>d<strong>in</strong>gs illustrate a problem with analyses where a certa<strong>in</strong> level of aggregation isemployed. This is known as Simpson’s paradox (Simpson, 1969). This occurs where dataaggregated up to a fairly large unit of analysis such as one month, mask subtle trendsapparent where data disaggregated to a f<strong>in</strong>er level of resolution (such as one week) are used.In this case, it would appear from the analysis shown <strong>in</strong> Table 2.7 that the risk to houses up to600m from victimised homes endures for around six to seven weeks rather than four. In anyevent, it is apparent that the risks are consistently greater with<strong>in</strong> the first month.Table 2.7: Weekly Knox ratios for Well<strong>in</strong>gborough (values <strong>in</strong> bold are statisticallysignificant accord<strong>in</strong>g to the residual scores (not shown), N=1350)WEEKS1 2 3 4 5 6 7 8 9 10 11 12100 1.82 1.78 1.76 1.67 1.53 1.39 1.22 1.06 0.97 0.87 0.78 0.76200 1.64 1.56 1.46 1.39 1.27 1.18 1.09 1.03 1.00 0.96 0.89 0.86300 1.52 1.43 1.37 1.29 1.20 1.12 1.04 1.00 0.94 0.91 0.88 0.88400 1.39 1.28 1.23 1.21 1.15 1.09 1.04 0.99 0.95 0.94 0.96 0.95500 1.27 1.23 1.19 1.18 1.13 1.11 1.06 1.04 1.01 0.98 0.97 0.95600 1.11 1.08 1.09 1.11 1.08 1.08 1.06 1.05 1.03 1.03 1.02 1.01700 1.02 1.01 1.02 1.00 1.02 1.04 1.06 1.06 1.04 1.01 1.00 1.00800 1.16 1.08 1.10 1.07 1.05 1.04 1.02 1.00 0.99 1.00 1.00 1.03900 1.04 1.03 1.01 1.01 1.01 0.99 0.98 0.97 0.98 0.98 0.98 0.981000 1.00 1.01 1.01 0.99 0.97 0.97 0.96 1.00 1.01 1.01 1.04 1.04Ashfield Police SectorFor Ashfield, the data cover the period January-December 2004 and a total of 1,012 burglaryevents. The results of the monthly Knox and Monte-Carlo analyses are shown as Tables 2.8and 2.9 respectively.9


