

Prospective crime mapping in operational context Final report
Prospective crime mapping in operational context Final report
Prospective crime mapping in operational context Final report
- No tags were found...

You also want an ePaper? Increase the reach of your titles
YUMPU automatically turns print PDFs into web optimized ePapers that Google loves.
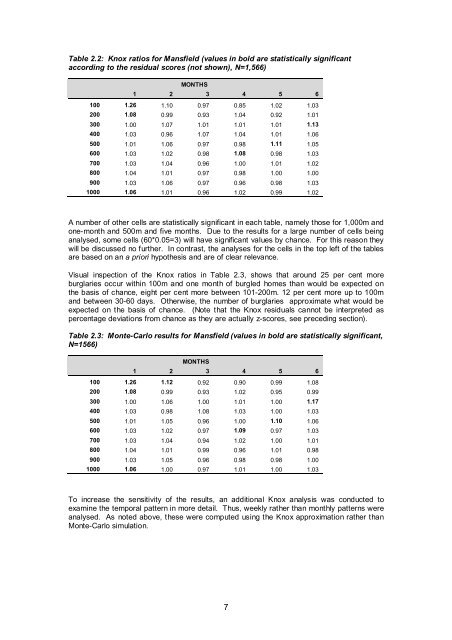
Table 2.2: Knox ratios for Mansfield (values <strong>in</strong> bold are statistically significantaccord<strong>in</strong>g to the residual scores (not shown), N=1,566)MONTHS1 2 3 4 5 6100 1.26 1.10 0.97 0.85 1.02 1.03200 1.08 0.99 0.93 1.04 0.92 1.01300 1.00 1.07 1.01 1.01 1.01 1.13400 1.03 0.96 1.07 1.04 1.01 1.06500 1.01 1.06 0.97 0.98 1.11 1.05600 1.03 1.02 0.98 1.08 0.98 1.03700 1.03 1.04 0.96 1.00 1.01 1.02800 1.04 1.01 0.97 0.98 1.00 1.00900 1.03 1.06 0.97 0.96 0.98 1.031000 1.06 1.01 0.96 1.02 0.99 1.02A number of other cells are statistically significant <strong>in</strong> each table, namely those for 1,000m andone-month and 500m and five months. Due to the results for a large number of cells be<strong>in</strong>ganalysed, some cells (60*0.05=3) will have significant values by chance. For this reason theywill be discussed no further. In contrast, the analyses for the cells <strong>in</strong> the top left of the tablesare based on an a priori hypothesis and are of clear relevance.Visual <strong>in</strong>spection of the Knox ratios <strong>in</strong> Table 2.3, shows that around 25 per cent moreburglaries occur with<strong>in</strong> 100m and one month of burgled homes than would be expected onthe basis of chance, eight per cent more between 101-200m. 12 per cent more up to 100mand between 30-60 days. Otherwise, the number of burglaries approximate what would beexpected on the basis of chance. (Note that the Knox residuals cannot be <strong>in</strong>terpreted aspercentage deviations from chance as they are actually z-scores, see preced<strong>in</strong>g section).Table 2.3: Monte-Carlo results for Mansfield (values <strong>in</strong> bold are statistically significant,N=1566)MONTHS1 2 3 4 5 6100 1.26 1.12 0.92 0.90 0.99 1.08200 1.08 0.99 0.93 1.02 0.95 0.99300 1.00 1.06 1.00 1.01 1.00 1.17400 1.03 0.98 1.08 1.03 1.00 1.03500 1.01 1.05 0.96 1.00 1.10 1.06600 1.03 1.02 0.97 1.09 0.97 1.03700 1.03 1.04 0.94 1.02 1.00 1.01800 1.04 1.01 0.99 0.96 1.01 0.98900 1.03 1.05 0.96 0.98 0.98 1.001000 1.06 1.00 0.97 1.01 1.00 1.03To <strong>in</strong>crease the sensitivity of the results, an additional Knox analysis was conducted toexam<strong>in</strong>e the temporal pattern <strong>in</strong> more detail. Thus, weekly rather than monthly patterns wereanalysed. As noted above, these were computed us<strong>in</strong>g the Knox approximation rather thanMonte-Carlo simulation.7


