

Prospective crime mapping in operational context Final report
Prospective crime mapping in operational context Final report
Prospective crime mapping in operational context Final report
- No tags were found...

You also want an ePaper? Increase the reach of your titles
YUMPU automatically turns print PDFs into web optimized ePapers that Google loves.
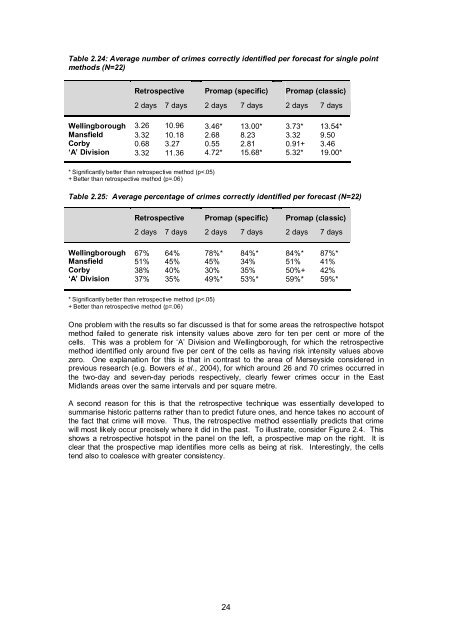
Table 2.24: Average number of <strong>crime</strong>s correctly identified per forecast for s<strong>in</strong>gle po<strong>in</strong>tmethods (N=22)Retrospective Promap (specific) Promap (classic)2 days 7 days 2 days 7 days 2 days 7 daysWell<strong>in</strong>gborough 3.26 10.96 3.46* 13.00* 3.73* 13.54*Mansfield 3.32 10.18 2.68 8.23 3.32 9.50Corby 0.68 3.27 0.55 2.81 0.91+ 3.46‘A’ Division 3.32 11.36 4.72* 15.68* 5.32* 19.00** Significantly better than retrospective method (p


