

Prospective crime mapping in operational context Final report
Prospective crime mapping in operational context Final report
Prospective crime mapping in operational context Final report
- No tags were found...

You also want an ePaper? Increase the reach of your titles
YUMPU automatically turns print PDFs into web optimized ePapers that Google loves.
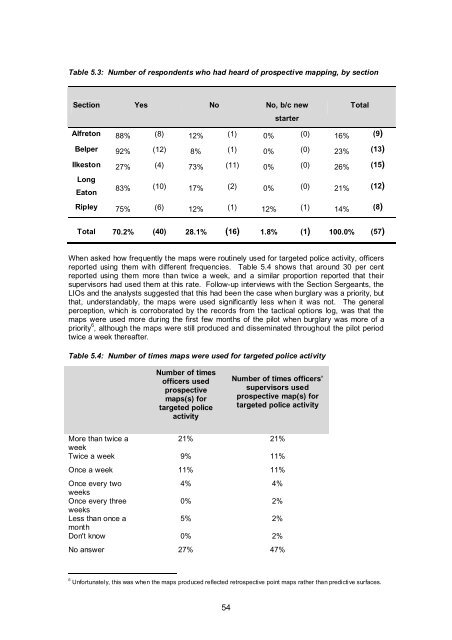
Table 5.3: Number of respondents who had heard of prospective <strong>mapp<strong>in</strong>g</strong>, by sectionSection Yes No No, b/c newTotalstarterAlfreton 88% (8) 12% (1) 0% (0) 16% (9)Belper 92% (12) 8% (1) 0% (0) 23% (13)Ilkeston 27% (4) 73% (11) 0% (0) 26% (15)LongEaton83% (10) 17% (2) 0% (0) 21% (12)Ripley 75% (6) 12% (1) 12% (1) 14% (8)Total 70.2% (40) 28.1% (16) 1.8% (1) 100.0% (57)When asked how frequently the maps were rout<strong>in</strong>ely used for targeted police activity, officers<strong>report</strong>ed us<strong>in</strong>g them with different frequencies. Table 5.4 shows that around 30 per cent<strong>report</strong>ed us<strong>in</strong>g them more than twice a week, and a similar proportion <strong>report</strong>ed that theirsupervisors had used them at this rate. Follow-up <strong>in</strong>terviews with the Section Sergeants, theLIOs and the analysts suggested that this had been the case when burglary was a priority, butthat, understandably, the maps were used significantly less when it was not. The generalperception, which is corroborated by the records from the tactical options log, was that themaps were used more dur<strong>in</strong>g the first few months of the pilot when burglary was more of apriority 6 , although the maps were still produced and dissem<strong>in</strong>ated throughout the pilot periodtwice a week thereafter.Table 5.4: Number of times maps were used for targeted police activityNumber of timesofficers usedprospectivemaps(s) fortargeted policeactivityNumber of times officers’supervisors usedprospective map(s) fortargeted police activityMore than twice a21% 21%weekTwice a week 9% 11%Once a week 11% 11%Once every two4% 4%weeksOnce every three0% 2%weeksLess than once a5% 2%monthDon't know 0% 2%No answer 27% 47%6 Unfortunately, this was when the maps produced reflected retrospective po<strong>in</strong>t maps rather than predictive surfaces.54


