

Prospective crime mapping in operational context Final report
Prospective crime mapping in operational context Final report
Prospective crime mapping in operational context Final report
- No tags were found...

Create successful ePaper yourself
Turn your PDF publications into a flip-book with our unique Google optimized e-Paper software.
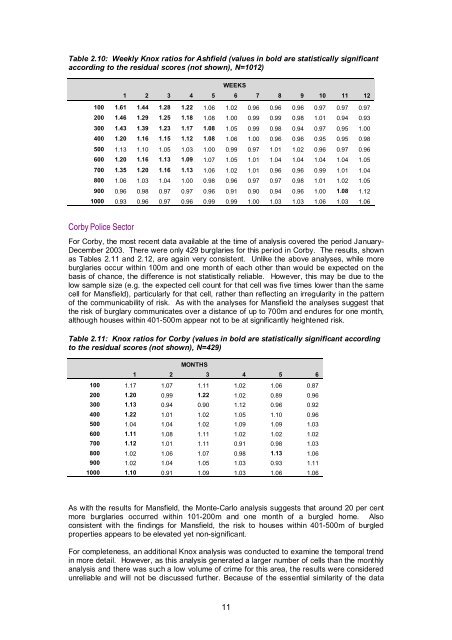
Table 2.10: Weekly Knox ratios for Ashfield (values <strong>in</strong> bold are statistically significantaccord<strong>in</strong>g to the residual scores (not shown), N=1012)WEEKS1 2 3 4 5 6 7 8 9 10 11 12100 1.61 1.44 1.28 1.22 1.06 1.02 0.96 0.96 0.96 0.97 0.97 0.97200 1.46 1.29 1.25 1.18 1.08 1.00 0.99 0.99 0.98 1.01 0.94 0.93300 1.43 1.39 1.23 1.17 1.08 1.05 0.99 0.98 0.94 0.97 0.95 1.00400 1.20 1.16 1.15 1.12 1.08 1.06 1.00 0.96 0.96 0.95 0.95 0.98500 1.13 1.10 1.05 1.03 1.00 0.99 0.97 1.01 1.02 0.96 0.97 0.96600 1.20 1.16 1.13 1.09 1.07 1.05 1.01 1.04 1.04 1.04 1.04 1.05700 1.35 1.20 1.16 1.13 1.06 1.02 1.01 0.96 0.96 0.99 1.01 1.04800 1.06 1.03 1.04 1.00 0.98 0.96 0.97 0.97 0.98 1.01 1.02 1.05900 0.96 0.98 0.97 0.97 0.96 0.91 0.90 0.94 0.96 1.00 1.08 1.121000 0.93 0.96 0.97 0.96 0.99 0.99 1.00 1.03 1.03 1.06 1.03 1.06Corby Police SectorFor Corby, the most recent data available at the time of analysis covered the period January-December 2003. There were only 429 burglaries for this period <strong>in</strong> Corby. The results, shownas Tables 2.11 and 2.12, are aga<strong>in</strong> very consistent. Unlike the above analyses, while moreburglaries occur with<strong>in</strong> 100m and one month of each other than would be expected on thebasis of chance, the difference is not statistically reliable. However, this may be due to thelow sample size (e.g. the expected cell count for that cell was five times lower than the samecell for Mansfield), particularly for that cell, rather than reflect<strong>in</strong>g an irregularity <strong>in</strong> the patternof the communicability of risk. As with the analyses for Mansfield the analyses suggest thatthe risk of burglary communicates over a distance of up to 700m and endures for one month,although houses with<strong>in</strong> 401-500m appear not to be at significantly heightened risk.Table 2.11: Knox ratios for Corby (values <strong>in</strong> bold are statistically significant accord<strong>in</strong>gto the residual scores (not shown), N=429)MONTHS1 2 3 4 5 6100 1.17 1.07 1.11 1.02 1.06 0.87200 1.20 0.99 1.22 1.02 0.89 0.96300 1.13 0.94 0.90 1.12 0.96 0.92400 1.22 1.01 1.02 1.05 1.10 0.96500 1.04 1.04 1.02 1.09 1.09 1.03600 1.11 1.08 1.11 1.02 1.02 1.02700 1.12 1.01 1.11 0.91 0.98 1.03800 1.02 1.06 1.07 0.98 1.13 1.06900 1.02 1.04 1.05 1.03 0.93 1.111000 1.10 0.91 1.09 1.03 1.06 1.06As with the results for Mansfield, the Monte-Carlo analysis suggests that around 20 per centmore burglaries occurred with<strong>in</strong> 101-200m and one month of a burgled home. Alsoconsistent with the f<strong>in</strong>d<strong>in</strong>gs for Mansfield, the risk to houses with<strong>in</strong> 401-500m of burgledproperties appears to be elevated yet non-significant.For completeness, an additional Knox analysis was conducted to exam<strong>in</strong>e the temporal trend<strong>in</strong> more detail. However, as this analysis generated a larger number of cells than the monthlyanalysis and there was such a low volume of <strong>crime</strong> for this area, the results were consideredunreliable and will not be discussed further. Because of the essential similarity of the data11


