

Prospective crime mapping in operational context Final report
Prospective crime mapping in operational context Final report
Prospective crime mapping in operational context Final report
- No tags were found...

Create successful ePaper yourself
Turn your PDF publications into a flip-book with our unique Google optimized e-Paper software.
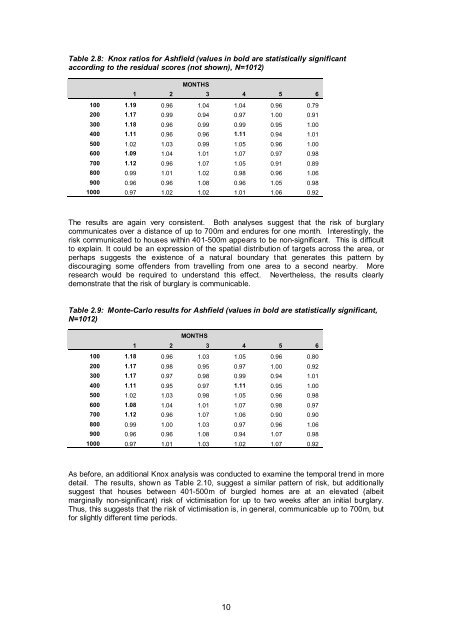
Table 2.8: Knox ratios for Ashfield (values <strong>in</strong> bold are statistically significantaccord<strong>in</strong>g to the residual scores (not shown), N=1012)MONTHS1 2 3 4 5 6100 1.19 0.96 1.04 1.04 0.96 0.79200 1.17 0.99 0.94 0.97 1.00 0.91300 1.18 0.96 0.99 0.99 0.95 1.00400 1.11 0.96 0.96 1.11 0.94 1.01500 1.02 1.03 0.99 1.05 0.96 1.00600 1.09 1.04 1.01 1.07 0.97 0.98700 1.12 0.96 1.07 1.05 0.91 0.89800 0.99 1.01 1.02 0.98 0.96 1.06900 0.96 0.96 1.08 0.96 1.05 0.981000 0.97 1.02 1.02 1.01 1.06 0.92The results are aga<strong>in</strong> very consistent. Both analyses suggest that the risk of burglarycommunicates over a distance of up to 700m and endures for one month. Interest<strong>in</strong>gly, therisk communicated to houses with<strong>in</strong> 401-500m appears to be non-significant. This is difficultto expla<strong>in</strong>. It could be an expression of the spatial distribution of targets across the area, orperhaps suggests the existence of a natural boundary that generates this pattern bydiscourag<strong>in</strong>g some offenders from travell<strong>in</strong>g from one area to a second nearby. Moreresearch would be required to understand this effect. Nevertheless, the results clearlydemonstrate that the risk of burglary is communicable.Table 2.9: Monte-Carlo results for Ashfield (values <strong>in</strong> bold are statistically significant,N=1012)MONTHS1 2 3 4 5 6100 1.18 0.96 1.03 1.05 0.96 0.80200 1.17 0.98 0.95 0.97 1.00 0.92300 1.17 0.97 0.98 0.99 0.94 1.01400 1.11 0.95 0.97 1.11 0.95 1.00500 1.02 1.03 0.98 1.05 0.96 0.98600 1.08 1.04 1.01 1.07 0.98 0.97700 1.12 0.96 1.07 1.06 0.90 0.90800 0.99 1.00 1.03 0.97 0.96 1.06900 0.96 0.96 1.08 0.94 1.07 0.981000 0.97 1.01 1.03 1.02 1.07 0.92As before, an additional Knox analysis was conducted to exam<strong>in</strong>e the temporal trend <strong>in</strong> moredetail. The results, shown as Table 2.10, suggest a similar pattern of risk, but additionallysuggest that houses between 401-500m of burgled homes are at an elevated (albeitmarg<strong>in</strong>ally non-significant) risk of victimisation for up to two weeks after an <strong>in</strong>itial burglary.Thus, this suggests that the risk of victimisation is, <strong>in</strong> general, communicable up to 700m, butfor slightly different time periods.10


