

Prospective crime mapping in operational context Final report
Prospective crime mapping in operational context Final report
Prospective crime mapping in operational context Final report
- No tags were found...

You also want an ePaper? Increase the reach of your titles
YUMPU automatically turns print PDFs into web optimized ePapers that Google loves.
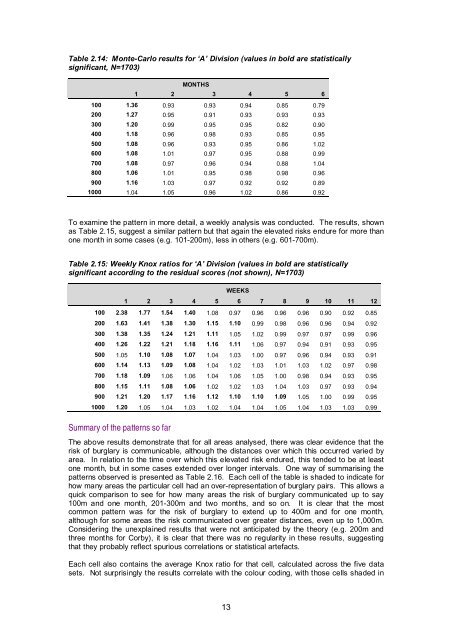
Table 2.14: Monte-Carlo results for ‘A’ Division (values <strong>in</strong> bold are statisticallysignificant, N=1703)MONTHS1 2 3 4 5 6100 1.36 0.93 0.93 0.94 0.85 0.79200 1.27 0.95 0.91 0.93 0.93 0.93300 1.20 0.99 0.95 0.95 0.82 0.90400 1.18 0.96 0.98 0.93 0.85 0.95500 1.08 0.96 0.93 0.95 0.86 1.02600 1.08 1.01 0.97 0.95 0.88 0.99700 1.08 0.97 0.96 0.94 0.88 1.04800 1.06 1.01 0.95 0.98 0.98 0.96900 1.16 1.03 0.97 0.92 0.92 0.891000 1.04 1.05 0.96 1.02 0.86 0.92To exam<strong>in</strong>e the pattern <strong>in</strong> more detail, a weekly analysis was conducted. The results, shownas Table 2.15, suggest a similar pattern but that aga<strong>in</strong> the elevated risks endure for more thanone month <strong>in</strong> some cases (e.g. 101-200m), less <strong>in</strong> others (e.g. 601-700m).Table 2.15: Weekly Knox ratios for ‘A’ Division (values <strong>in</strong> bold are statisticallysignificant accord<strong>in</strong>g to the residual scores (not shown), N=1703)WEEKS1 2 3 4 5 6 7 8 9 10 11 12100 2.38 1.77 1.54 1.40 1.08 0.97 0.96 0.96 0.96 0.90 0.92 0.85200 1.63 1.41 1.38 1.30 1.15 1.10 0.99 0.98 0.96 0.96 0.94 0.92300 1.38 1.35 1.24 1.21 1.11 1.05 1.02 0.99 0.97 0.97 0.99 0.96400 1.26 1.22 1.21 1.18 1.16 1.11 1.06 0.97 0.94 0.91 0.93 0.95500 1.05 1.10 1.08 1.07 1.04 1.03 1.00 0.97 0.96 0.94 0.93 0.91600 1.14 1.13 1.09 1.08 1.04 1.02 1.03 1.01 1.03 1.02 0.97 0.98700 1.18 1.09 1.06 1.06 1.04 1.06 1.05 1.00 0.98 0.94 0.93 0.95800 1.15 1.11 1.08 1.06 1.02 1.02 1.03 1.04 1.03 0.97 0.93 0.94900 1.21 1.20 1.17 1.16 1.12 1.10 1.10 1.09 1.05 1.00 0.99 0.951000 1.20 1.05 1.04 1.03 1.02 1.04 1.04 1.05 1.04 1.03 1.03 0.99Summary of the patterns so farThe above results demonstrate that for all areas analysed, there was clear evidence that therisk of burglary is communicable, although the distances over which this occurred varied byarea. In relation to the time over which this elevated risk endured, this tended to be at leastone month, but <strong>in</strong> some cases extended over longer <strong>in</strong>tervals. One way of summaris<strong>in</strong>g thepatterns observed is presented as Table 2.16. Each cell of the table is shaded to <strong>in</strong>dicate forhow many areas the particular cell had an over-representation of burglary pairs. This allows aquick comparison to see for how many areas the risk of burglary communicated up to say100m and one month, 201-300m and two months, and so on. It is clear that the mostcommon pattern was for the risk of burglary to extend up to 400m and for one month,although for some areas the risk communicated over greater distances, even up to 1,000m.Consider<strong>in</strong>g the unexpla<strong>in</strong>ed results that were not anticipated by the theory (e.g. 200m andthree months for Corby), it is clear that there was no regularity <strong>in</strong> these results, suggest<strong>in</strong>gthat they probably reflect spurious correlations or statistical artefacts.Each cell also conta<strong>in</strong>s the average Knox ratio for that cell, calculated across the five datasets. Not surpris<strong>in</strong>gly the results correlate with the colour cod<strong>in</strong>g, with those cells shaded <strong>in</strong>13


