

Prospective crime mapping in operational context Final report
Prospective crime mapping in operational context Final report
Prospective crime mapping in operational context Final report
- No tags were found...

You also want an ePaper? Increase the reach of your titles
YUMPU automatically turns print PDFs into web optimized ePapers that Google loves.
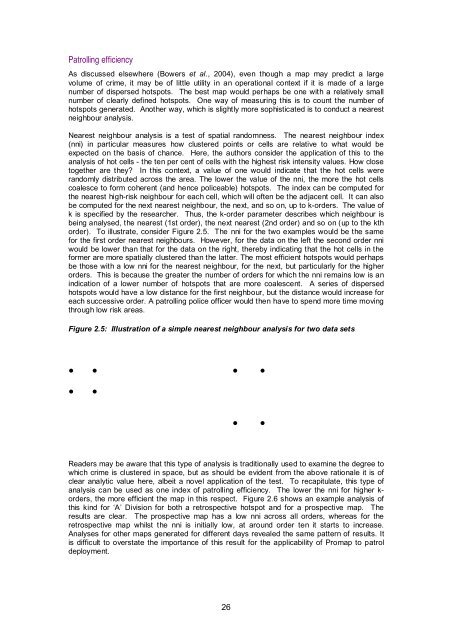
Patroll<strong>in</strong>g efficiencyAs discussed elsewhere (Bowers et al., 2004), even though a map may predict a largevolume of <strong>crime</strong>, it may be of little utility <strong>in</strong> an <strong>operational</strong> <strong>context</strong> if it is made of a largenumber of dispersed hotspots. The best map would perhaps be one with a relatively smallnumber of clearly def<strong>in</strong>ed hotspots. One way of measur<strong>in</strong>g this is to count the number ofhotspots generated. Another way, which is slightly more sophisticated is to conduct a nearestneighbour analysis.Nearest neighbour analysis is a test of spatial randomness. The nearest neighbour <strong>in</strong>dex(nni) <strong>in</strong> particular measures how clustered po<strong>in</strong>ts or cells are relative to what would beexpected on the basis of chance. Here, the authors consider the application of this to theanalysis of hot cells - the ten per cent of cells with the highest risk <strong>in</strong>tensity values. How closetogether are they? In this <strong>context</strong>, a value of one would <strong>in</strong>dicate that the hot cells wererandomly distributed across the area. The lower the value of the nni, the more the hot cellscoalesce to form coherent (and hence policeable) hotspots. The <strong>in</strong>dex can be computed forthe nearest high-risk neighbour for each cell, which will often be the adjacent cell. It can alsobe computed for the next nearest neighbour, the next, and so on, up to k-orders. The value ofk is specified by the researcher. Thus, the k-order parameter describes which neighbour isbe<strong>in</strong>g analysed, the nearest (1st order), the next nearest (2nd order) and so on (up to the kthorder). To illustrate, consider Figure 2.5. The nni for the two examples would be the samefor the first order nearest neighbours. However, for the data on the left the second order nniwould be lower than that for the data on the right, thereby <strong>in</strong>dicat<strong>in</strong>g that the hot cells <strong>in</strong> theformer are more spatially clustered than the latter. The most efficient hotspots would perhapsbe those with a low nni for the nearest neighbour, for the next, but particularly for the higherorders. This is because the greater the number of orders for which the nni rema<strong>in</strong>s low is an<strong>in</strong>dication of a lower number of hotspots that are more coalescent. A series of dispersedhotspots would have a low distance for the first neighbour, but the distance would <strong>in</strong>crease foreach successive order. A patroll<strong>in</strong>g police officer would then have to spend more time mov<strong>in</strong>gthrough low risk areas.Figure 2.5: Illustration of a simple nearest neighbour analysis for two data sets● ● ● ●●●●●Readers may be aware that this type of analysis is traditionally used to exam<strong>in</strong>e the degree towhich <strong>crime</strong> is clustered <strong>in</strong> space, but as should be evident from the above rationale it is ofclear analytic value here, albeit a novel application of the test. To recapitulate, this type ofanalysis can be used as one <strong>in</strong>dex of patroll<strong>in</strong>g efficiency. The lower the nni for higher k-orders, the more efficient the map <strong>in</strong> this respect. Figure 2.6 shows an example analysis ofthis k<strong>in</strong>d for ‘A’ Division for both a retrospective hotspot and for a prospective map. Theresults are clear. The prospective map has a low nni across all orders, whereas for theretrospective map whilst the nni is <strong>in</strong>itially low, at around order ten it starts to <strong>in</strong>crease.Analyses for other maps generated for different days revealed the same pattern of results. Itis difficult to overstate the importance of this result for the applicability of Promap to patroldeployment.26


