

Prospective crime mapping in operational context Final report
Prospective crime mapping in operational context Final report
Prospective crime mapping in operational context Final report
- No tags were found...

Create successful ePaper yourself
Turn your PDF publications into a flip-book with our unique Google optimized e-Paper software.
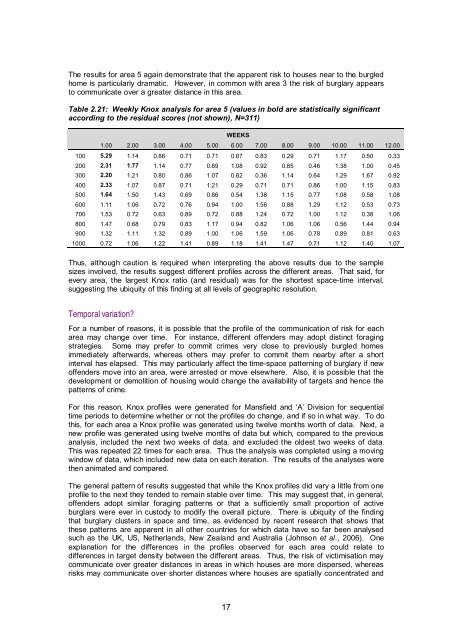
The results for area 5 aga<strong>in</strong> demonstrate that the apparent risk to houses near to the burgledhome is particularly dramatic. However, <strong>in</strong> common with area 3 the risk of burglary appearsto communicate over a greater distance <strong>in</strong> this area.Table 2.21: Weekly Knox analysis for area 5 (values <strong>in</strong> bold are statistically significantaccord<strong>in</strong>g to the residual scores (not shown), N=311)WEEKS1.00 2.00 3.00 4.00 5.00 6.00 7.00 8.00 9.00 10.00 11.00 12.00100 5.29 1.14 0.86 0.71 0.71 0.67 0.83 0.29 0.71 1.17 0.50 0.33200 2.31 1.77 1.14 0.77 0.69 1.08 0.92 0.85 0.46 1.38 1.00 0.45300 2.20 1.21 0.80 0.86 1.07 0.62 0.36 1.14 0.64 1.29 1.67 0.92400 2.33 1.07 0.87 0.71 1.21 0.29 0.71 0.71 0.86 1.00 1.15 0.83500 1.64 1.50 1.43 0.69 0.86 0.54 1.38 1.15 0.77 1.08 0.58 1.08600 1.11 1.06 0.72 0.76 0.94 1.00 1.56 0.88 1.29 1.12 0.53 0.73700 1.53 0.72 0.63 0.89 0.72 0.88 1.24 0.72 1.00 1.12 0.38 1.06800 1.47 0.68 0.79 0.83 1.17 0.94 0.82 1.06 1.06 0.56 1.44 0.94900 1.32 1.11 1.32 0.89 1.00 1.06 1.59 1.06 0.78 0.89 0.81 0.631000 0.72 1.06 1.22 1.41 0.89 1.18 1.41 1.47 0.71 1.12 1.40 1.07Thus, although caution is required when <strong>in</strong>terpret<strong>in</strong>g the above results due to the samplesizes <strong>in</strong>volved, the results suggest different profiles across the different areas. That said, forevery area, the largest Knox ratio (and residual) was for the shortest space-time <strong>in</strong>terval,suggest<strong>in</strong>g the ubiquity of this f<strong>in</strong>d<strong>in</strong>g at all levels of geographic resolution.Temporal variation?For a number of reasons, it is possible that the profile of the communication of risk for eacharea may change over time. For <strong>in</strong>stance, different offenders may adopt dist<strong>in</strong>ct forag<strong>in</strong>gstrategies. Some may prefer to commit <strong>crime</strong>s very close to previously burgled homesimmediately afterwards, whereas others may prefer to commit them nearby after a short<strong>in</strong>terval has elapsed. This may particularly affect the time-space pattern<strong>in</strong>g of burglary if newoffenders move <strong>in</strong>to an area, were arrested or move elsewhere. Also, it is possible that thedevelopment or demolition of hous<strong>in</strong>g would change the availability of targets and hence thepatterns of <strong>crime</strong>.For this reason, Knox profiles were generated for Mansfield and ‘A’ Division for sequentialtime periods to determ<strong>in</strong>e whether or not the profiles do change, and if so <strong>in</strong> what way. To dothis, for each area a Knox profile was generated us<strong>in</strong>g twelve months worth of data. Next, anew profile was generated us<strong>in</strong>g twelve months of data but which, compared to the previousanalysis, <strong>in</strong>cluded the next two weeks of data, and excluded the oldest two weeks of data.This was repeated 22 times for each area. Thus the analysis was completed us<strong>in</strong>g a mov<strong>in</strong>gw<strong>in</strong>dow of data, which <strong>in</strong>cluded new data on each iteration. The results of the analyses werethen animated and compared.The general pattern of results suggested that while the Knox profiles did vary a little from oneprofile to the next they tended to rema<strong>in</strong> stable over time. This may suggest that, <strong>in</strong> general,offenders adopt similar forag<strong>in</strong>g patterns or that a sufficiently small proportion of activeburglars were ever <strong>in</strong> custody to modify the overall picture. There is ubiquity of the f<strong>in</strong>d<strong>in</strong>gthat burglary clusters <strong>in</strong> space and time, as evidenced by recent research that shows thatthese patterns are apparent <strong>in</strong> all other countries for which data have so far been analysedsuch as the UK, US, Netherlands, New Zealand and Australia (Johnson et al., 2006). Oneexplanation for the differences <strong>in</strong> the profiles observed for each area could relate todifferences <strong>in</strong> target density between the different areas. Thus, the risk of victimisation maycommunicate over greater distances <strong>in</strong> areas <strong>in</strong> which houses are more dispersed, whereasrisks may communicate over shorter distances where houses are spatially concentrated and17


