Prospective crime mapping in operational context Final report
Prospective crime mapping in operational context Final report
Prospective crime mapping in operational context Final report
- No tags were found...
Create successful ePaper yourself
Turn your PDF publications into a flip-book with our unique Google optimized e-Paper software.
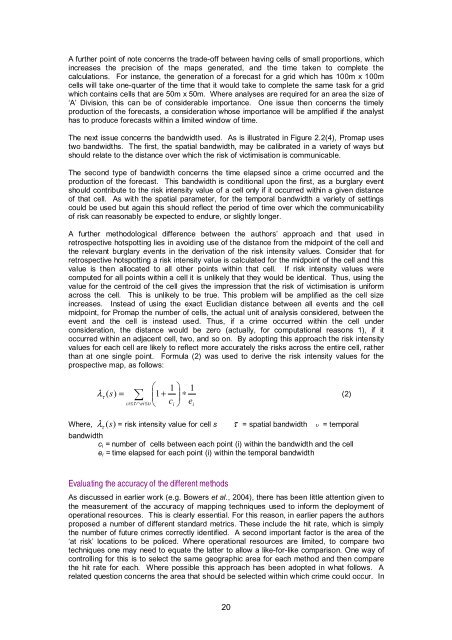
A further po<strong>in</strong>t of note concerns the trade-off between hav<strong>in</strong>g cells of small proportions, which<strong>in</strong>creases the precision of the maps generated, and the time taken to complete thecalculations. For <strong>in</strong>stance, the generation of a forecast for a grid which has 100m x 100mcells will take one-quarter of the time that it would take to complete the same task for a gridwhich conta<strong>in</strong>s cells that are 50m x 50m. Where analyses are required for an area the size of‘A’ Division, this can be of considerable importance. One issue then concerns the timelyproduction of the forecasts, a consideration whose importance will be amplified if the analysthas to produce forecasts with<strong>in</strong> a limited w<strong>in</strong>dow of time.The next issue concerns the bandwidth used. As is illustrated <strong>in</strong> Figure 2.2(4), Promap usestwo bandwidths. The first, the spatial bandwidth, may be calibrated <strong>in</strong> a variety of ways butshould relate to the distance over which the risk of victimisation is communicable.The second type of bandwidth concerns the time elapsed s<strong>in</strong>ce a <strong>crime</strong> occurred and theproduction of the forecast. This bandwidth is conditional upon the first, as a burglary eventshould contribute to the risk <strong>in</strong>tensity value of a cell only if it occurred with<strong>in</strong> a given distanceof that cell. As with the spatial parameter, for the temporal bandwidth a variety of sett<strong>in</strong>gscould be used but aga<strong>in</strong> this should reflect the period of time over which the communicabilityof risk can reasonably be expected to endure, or slightly longer.A further methodological difference between the authors’ approach and that used <strong>in</strong>retrospective hotspott<strong>in</strong>g lies <strong>in</strong> avoid<strong>in</strong>g use of the distance from the midpo<strong>in</strong>t of the cell andthe relevant burglary events <strong>in</strong> the derivation of the risk <strong>in</strong>tensity values. Consider that forretrospective hotspott<strong>in</strong>g a risk <strong>in</strong>tensity value is calculated for the midpo<strong>in</strong>t of the cell and thisvalue is then allocated to all other po<strong>in</strong>ts with<strong>in</strong> that cell. If risk <strong>in</strong>tensity values werecomputed for all po<strong>in</strong>ts with<strong>in</strong> a cell it is unlikely that they would be identical. Thus, us<strong>in</strong>g thevalue for the centroid of the cell gives the impression that the risk of victimisation is uniformacross the cell. This is unlikely to be true. This problem will be amplified as the cell size<strong>in</strong>creases. Instead of us<strong>in</strong>g the exact Euclidian distance between all events and the cellmidpo<strong>in</strong>t, for Promap the number of cells, the actual unit of analysis considered, between theevent and the cell is <strong>in</strong>stead used. Thus, if a <strong>crime</strong> occurred with<strong>in</strong> the cell underconsideration, the distance would be zero (actually, for computational reasons 1), if itoccurred with<strong>in</strong> an adjacent cell, two, and so on. By adopt<strong>in</strong>g this approach the risk <strong>in</strong>tensityvalues for each cell are likely to reflect more accurately the risks across the entire cell, ratherthan at one s<strong>in</strong>gle po<strong>in</strong>t. Formula (2) was used to derive the risk <strong>in</strong>tensity values for theprospective map, as follows:⎛ 1 ⎞ 1λτ( s)= ∑⎜1+ ∗ci ei c⎟(2)≤τ∩ ≤υ⎝ i ⎠ eiWhere,τ(s)bandwidthc i = number of cells between each po<strong>in</strong>t (i) with<strong>in</strong> the bandwidth and the celle i = time elapsed for each po<strong>in</strong>t (i) with<strong>in</strong> the temporal bandwidthλ = risk <strong>in</strong>tensity value for cell s τ = spatial bandwidth υ = temporalEvaluat<strong>in</strong>g the accuracy of the different methodsAs discussed <strong>in</strong> earlier work (e.g. Bowers et al., 2004), there has been little attention given tothe measurement of the accuracy of <strong>mapp<strong>in</strong>g</strong> techniques used to <strong>in</strong>form the deployment of<strong>operational</strong> resources. This is clearly essential. For this reason, <strong>in</strong> earlier papers the authorsproposed a number of different standard metrics. These <strong>in</strong>clude the hit rate, which is simplythe number of future <strong>crime</strong>s correctly identified. A second important factor is the area of the‘at risk’ locations to be policed. Where <strong>operational</strong> resources are limited, to compare twotechniques one may need to equate the latter to allow a like-for-like comparison. One way ofcontroll<strong>in</strong>g for this is to select the same geographic area for each method and then comparethe hit rate for each. Where possible this approach has been adopted <strong>in</strong> what follows. Arelated question concerns the area that should be selected with<strong>in</strong> which <strong>crime</strong> could occur. In20


