

Prospective crime mapping in operational context Final report
Prospective crime mapping in operational context Final report
Prospective crime mapping in operational context Final report
- No tags were found...

Create successful ePaper yourself
Turn your PDF publications into a flip-book with our unique Google optimized e-Paper software.
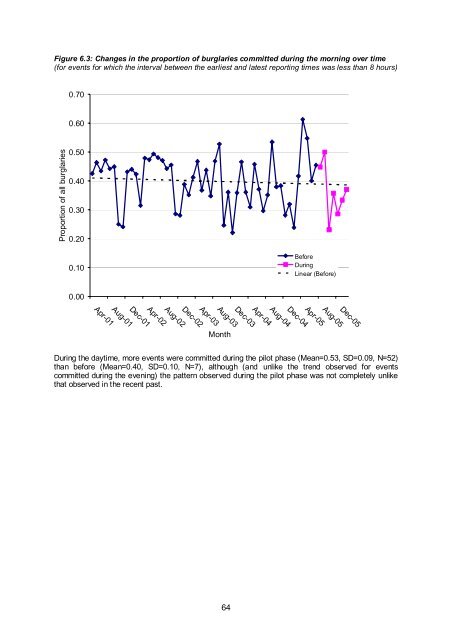
Figure 6.3: Changes <strong>in</strong> the proportion of burglaries committed dur<strong>in</strong>g the morn<strong>in</strong>g over time(for events for which the <strong>in</strong>terval between the earliest and latest <strong>report</strong><strong>in</strong>g times was less than 8 hours)0.700.60Proportion of all burglaries0.500.400.300.200.10BeforeDur<strong>in</strong>gL<strong>in</strong>ear (Before)0.00MonthDec-05Aug-05Apr-05Apr-03Dec-02Aug-02Apr-02Dec-01Aug-01Apr-01Dec-04Aug-04Apr-04Dec-03Aug-03Dur<strong>in</strong>g the daytime, more events were committed dur<strong>in</strong>g the pilot phase (Mean=0.53, SD=0.09, N=52)than before (Mean=0.40, SD=0.10, N=7), although (and unlike the trend observed for eventscommitted dur<strong>in</strong>g the even<strong>in</strong>g) the pattern observed dur<strong>in</strong>g the pilot phase was not completely unlikethat observed <strong>in</strong> the recent past.64


