Prospective crime mapping in operational context Final report
Prospective crime mapping in operational context Final report
Prospective crime mapping in operational context Final report
- No tags were found...
Create successful ePaper yourself
Turn your PDF publications into a flip-book with our unique Google optimized e-Paper software.
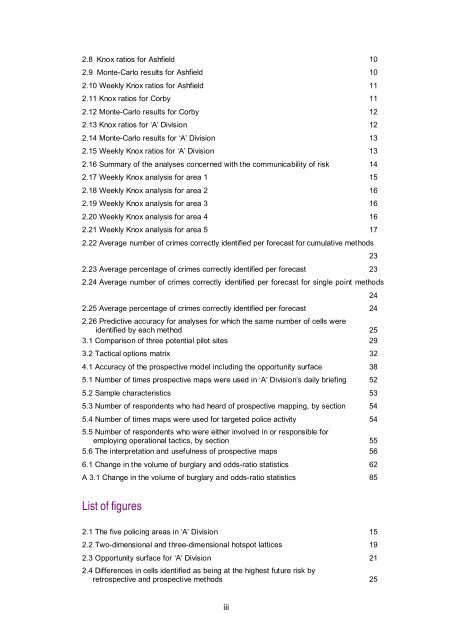
2.8 Knox ratios for Ashfield 102.9 Monte-Carlo results for Ashfield 102.10 Weekly Knox ratios for Ashfield 112.11 Knox ratios for Corby 112.12 Monte-Carlo results for Corby 122.13 Knox ratios for ‘A’ Division 122.14 Monte-Carlo results for ‘A’ Division 132.15 Weekly Knox ratios for ‘A’ Division 132.16 Summary of the analyses concerned with the communicability of risk 142.17 Weekly Knox analysis for area 1 152.18 Weekly Knox analysis for area 2 162.19 Weekly Knox analysis for area 3 162.20 Weekly Knox analysis for area 4 162.21 Weekly Knox analysis for area 5 172.22 Average number of <strong>crime</strong>s correctly identified per forecast for cumulative methods232.23 Average percentage of <strong>crime</strong>s correctly identified per forecast 232.24 Average number of <strong>crime</strong>s correctly identified per forecast for s<strong>in</strong>gle po<strong>in</strong>t methods242.25 Average percentage of <strong>crime</strong>s correctly identified per forecast 242.26 Predictive accuracy for analyses for which the same number of cells wereidentified by each method 253.1 Comparison of three potential pilot sites 293.2 Tactical options matrix 324.1 Accuracy of the prospective model <strong>in</strong>clud<strong>in</strong>g the opportunity surface 385.1 Number of times prospective maps were used <strong>in</strong> ‘A’ Division’s daily brief<strong>in</strong>g 525.2 Sample characteristics 535.3 Number of respondents who had heard of prospective <strong>mapp<strong>in</strong>g</strong>, by section 545.4 Number of times maps were used for targeted police activity 545.5 Number of respondents who were either <strong>in</strong>volved <strong>in</strong> or responsible foremploy<strong>in</strong>g <strong>operational</strong> tactics, by section 555.6 The <strong>in</strong>terpretation and usefulness of prospective maps 566.1 Change <strong>in</strong> the volume of burglary and odds-ratio statistics 62A 3.1 Change <strong>in</strong> the volume of burglary and odds-ratio statistics 85List of figures2.1 The five polic<strong>in</strong>g areas <strong>in</strong> ‘A’ Division 152.2 Two-dimensional and three-dimensional hotspot lattices 192.3 Opportunity surface for ‘A’ Division 212.4 Differences <strong>in</strong> cells identified as be<strong>in</strong>g at the highest future risk byretrospective and prospective methods 25iii


