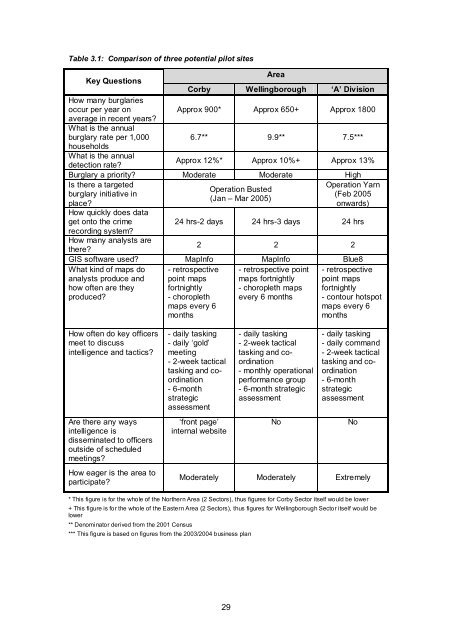
Table 3.1: Comparison of three potential pilot sitesKey QuestionsHow many burglariesoccur per year onaverage <strong>in</strong> recent years?What is the annualburglary rate per 1,000householdsWhat is the annualdetection rate?AreaCorby Well<strong>in</strong>gborough ‘A’ DivisionApprox 900* Approx 650+ Approx 18006.7** 9.9** 7.5***Approx 12%* Approx 10%+ Approx 13%Burglary a priority? Moderate Moderate HighIs there a targetedOperation Bustedburglary <strong>in</strong>itiative <strong>in</strong>(Jan – Mar 2005)place?How quickly does dataget onto the <strong>crime</strong>record<strong>in</strong>g system?Operation Yarn(Feb 2005onwards)24 hrs-2 days 24 hrs-3 days 24 hrsHow many analysts arethere?2 2 2GIS software used? MapInfo MapInfo Blue8What k<strong>in</strong>d of maps doanalysts produce andhow often are theyproduced?- retrospective po<strong>in</strong>tmaps fortnightly- choropleth mapsevery 6 months- retrospectivepo<strong>in</strong>t mapsfortnightly- choroplethmaps every 6months- retrospectivepo<strong>in</strong>t mapsfortnightly- contour hotspotmaps every 6monthsHow often do key officersmeet to discuss<strong>in</strong>telligence and tactics?Are there any ways<strong>in</strong>telligence isdissem<strong>in</strong>ated to officersoutside of scheduledmeet<strong>in</strong>gs?How eager is the area toparticipate?- daily task<strong>in</strong>g- daily ‘gold’meet<strong>in</strong>g- 2-week tacticaltask<strong>in</strong>g and coord<strong>in</strong>ation- 6-monthstrategicassessment‘front page’<strong>in</strong>ternal website- daily task<strong>in</strong>g- 2-week tacticaltask<strong>in</strong>g and coord<strong>in</strong>ation- monthly <strong>operational</strong>performance group- 6-month strategicassessmentNo- daily task<strong>in</strong>g- daily command- 2-week tacticaltask<strong>in</strong>g and coord<strong>in</strong>ation- 6-monthstrategicassessmentNoModerately Moderately Extremely* This figure is for the whole of the Northern Area (2 Sectors), thus figures for Corby Sector itself would be lower+ This figure is for the whole of the Eastern Area (2 Sectors), thus figures for Well<strong>in</strong>gborough Sector itself would belower** Denom<strong>in</strong>ator derived from the 2001 Census*** This figure is based on figures from the 2003/2004 bus<strong>in</strong>ess plan29
Select<strong>in</strong>g a pilot siteThe decision as to which area <strong>in</strong> which to implement the pilot was taken by a steer<strong>in</strong>g groupwhich <strong>in</strong>cluded members of the Home Office, Government Office for the East Midlands andresearchers from the UCL Jill Dando Institute of Crime Science. The ma<strong>in</strong> reasons forselect<strong>in</strong>g the site chosen, ‘A’ Division, were that the Command Team expressed a strongdesire to participate <strong>in</strong> the pilot, they were especially concerned with the residential burglaryproblem <strong>in</strong> their Division, and they had been experienc<strong>in</strong>g a stable volume of burglary prior tothe pilot.A tactical options matrix for reduc<strong>in</strong>g burglaryInnovations require new ways of th<strong>in</strong>k<strong>in</strong>g. Early software often sought to mimic electronicallywhat had previously been done manually. Only with time was the potential to do th<strong>in</strong>gs <strong>in</strong> newways realised. One poignant <strong>in</strong>stance of how <strong>in</strong>novation requires reth<strong>in</strong>k<strong>in</strong>g comes with the<strong>in</strong>troduction of the battle tank. Its qualified success upon <strong>in</strong>troduction at the Battle of Cambraiderived from the failure to modify <strong>in</strong>fantry movements to capitalise on the advantages createdby the tank, with long-term unhappy consequences for military tactics (see Dixon 1976). Theworst fate for Promap (short of neglect) would be implementation without reth<strong>in</strong>k<strong>in</strong>g polic<strong>in</strong>gtactics.As noted above, prior to the start of the pilot a literature review was undertaken to summarisethe available literature on tactical options used <strong>in</strong> the reduction of burglary, so that those thatmight be used <strong>in</strong> response to the maps could be identified. However, by outl<strong>in</strong><strong>in</strong>g theapparent efficacy of extant burglary reduction tactics, <strong>in</strong> a sense one falls <strong>in</strong>to the mode ofthought which Promap is <strong>in</strong>tended to make obsolete. Improv<strong>in</strong>g one’s capacity to predictthereby changes the terra<strong>in</strong>. It may mean that hitherto untried or apparently unsuccessfulapproaches become potentially effective. For example, the potential of patroll<strong>in</strong>g as a <strong>crime</strong>reductive measure has generally been considered low, but when directed by better prediction,this may change. At the risk of appear<strong>in</strong>g to oversell Promap, it may change the ground rulesfor <strong>crime</strong> reduction. For this reason, it was strongly emphasised that the learn<strong>in</strong>g process<strong>in</strong>volved <strong>in</strong> field test<strong>in</strong>g may <strong>in</strong>volve reth<strong>in</strong>k<strong>in</strong>g some of what is set out below.There is no s<strong>in</strong>gle menu of burglary reductive options that is guaranteed to work <strong>in</strong> allcircumstances, rather measures need to be tailored accord<strong>in</strong>g to the specific opportunitiesand situations apparent <strong>in</strong> an area. One of the ma<strong>in</strong> reasons why replications of <strong>in</strong>terventionsoften fail is because the knowledge and understand<strong>in</strong>g of the specific <strong>context</strong>s andmechanisms for an <strong>in</strong>tervention are lack<strong>in</strong>g (Tilley, 1993). Sometimes sheer lack of effortmakes for implementation failure. Someth<strong>in</strong>g that has been successful <strong>in</strong> one area or situationwill not automatically be successful <strong>in</strong> others. As such, it must be recognised that whichevertactical options are selected to be used with the predictive <strong>mapp<strong>in</strong>g</strong> system, they may need tobe specifically tailored for the purpose of reduc<strong>in</strong>g residential burglary <strong>in</strong> the chosen pilotarea. Moreover, the most effective burglary prevention strategies <strong>in</strong>volve a comb<strong>in</strong>ation ofcomplementary responses (Lamm Weisel, 2002), and hence consideration of how a variety ofdifferent <strong>in</strong>terventions might <strong>in</strong>teract, and/or complement the system should be considered.To <strong>in</strong>form this element of the project, a review of the available literature was conducted and ispresented here as a Tactical Option Matrix <strong>in</strong> Table 3.2. The matrix can be broken down <strong>in</strong>tofive ma<strong>in</strong> component parts: the type of <strong>in</strong>tervention, a summary of the evidence of itseffectiveness, cost (f<strong>in</strong>ancial and latency of implementation), the geographical coverage of themeasures, and the potential partners who may be <strong>in</strong>volved <strong>in</strong> the implementation of that<strong>in</strong>tervention. The follow<strong>in</strong>g sections elaborate upon and clarify the content of these fiveelements of the matrix.Types of <strong>in</strong>tervention and evidence of effectivenessThe list is not exhaustive by any means, however, the most commonly used <strong>crime</strong> preventionmeasures for reduc<strong>in</strong>g residential burglary are discussed. Over the last two decades therehas been a plethora of research on the effectiveness of various types of <strong>crime</strong> preventionmeasures and some of the key studies are mentioned here. While the authors are cognisant30
- Page 2 and 3: 1. UCL JILL DANDO INSTITUTE OF CRIM
- Page 4 and 5: ContentsAcknowledgementsExecutive s
- Page 6 and 7: 2.5 Illustration of a simple neares
- Page 8 and 9: Project outcomesPatterns of burglar
- Page 10 and 11: those that involved collaboration w
- Page 12 and 13: 1. IntroductionThis report represen
- Page 14 and 15: optimally calibrated system, the go
- Page 16 and 17: e ij = n .j x n i.nWhere, e ij is t
- Page 18 and 19: Table 2.2: Knox ratios for Mansfiel
- Page 20 and 21: Table 2.6: Monte-Carlo results for
- Page 22 and 23: Table 2.10: Weekly Knox ratios for
- Page 24 and 25: Table 2.14: Monte-Carlo results for
- Page 26 and 27: Figure 2.1: The five policing areas
- Page 28 and 29: The results for area 5 again demons
- Page 30 and 31: The bandwidth used to generate the
- Page 32: a densely populated urban area this
- Page 35 and 36: Table 2.24: Average number of crime
- Page 37 and 38: Patrolling efficiencyAs discussed e
- Page 39: 3. Tactical options and selecting a
- Page 43 and 44: Table 3.2: Tactical options matrixT
- Page 45 and 46: Type ofinterventionStudyUse ofintel
- Page 47 and 48: Other potential tactical optionsAt
- Page 49 and 50: 4. System development and evolution
- Page 51 and 52: the same time of day as each other
- Page 53 and 54: unfortunately, implementation or us
- Page 55 and 56: any tactical options were employed
- Page 57 and 58: the end of the pilot. In addition t
- Page 59 and 60: Figure 5.1: Promap dissemination pr
- Page 61 and 62: the busy schedule of the new Divisi
- Page 63 and 64: Tactical deliveryCommand Team daily
- Page 65 and 66: Table 5.3: Number of respondents wh
- Page 67 and 68: permitted, up to four plain clothed
- Page 69 and 70: observation made by those who used
- Page 71 and 72: A simple time-series analysis (see
- Page 73 and 74: Two approaches were used to compute
- Page 75 and 76: Figure 6.3: Changes in the proporti
- Page 77 and 78: Figure 6.5: Changes in the proporti
- Page 79 and 80: With respect to implementation real
- Page 81 and 82: ReferencesAggresti, A. (1996) An In
- Page 83 and 84: Johnson, S.D., Summers, L., and Pea
- Page 85 and 86: Appendix 1. The information technol
- Page 87 and 88: Figure A1.2: Stand-alone applicatio
- Page 89 and 90: Recommendations that may be realise
- Page 91 and 92:
Section 1: knowledge and understand
- Page 93 and 94:
Extra Comments (please outline any
- Page 95 and 96:
In relation to the evaluation of in
- Page 97 and 98:
Time-series analysisFor the purpose
- Page 99 and 100:
Figure A3.1: Changes in the spatial
- Page 101 and 102:
Figure A3.2: Lorenz curves showing
- Page 103 and 104:
To recapitulate and elaborate, the
- Page 105 and 106:
Concluding comments on methodThe te
- Page 107 and 108:
Figure A5.2: An enlargement of the
- Page 109 and 110:
Figure A5.6: Prospective map magnif
- Page 111:
Produced by the Research Developmen