

Prospective crime mapping in operational context Final report
Prospective crime mapping in operational context Final report
Prospective crime mapping in operational context Final report
- No tags were found...

You also want an ePaper? Increase the reach of your titles
YUMPU automatically turns print PDFs into web optimized ePapers that Google loves.
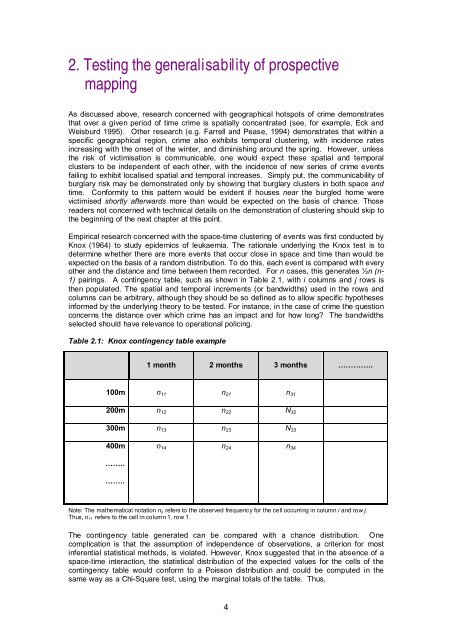
2. Test<strong>in</strong>g the generalisability of prospective<strong>mapp<strong>in</strong>g</strong>As discussed above, research concerned with geographical hotspots of <strong>crime</strong> demonstratesthat over a given period of time <strong>crime</strong> is spatially concentrated (see, for example, Eck andWeisburd 1995). Other research (e.g. Farrell and Pease, 1994) demonstrates that with<strong>in</strong> aspecific geographical region, <strong>crime</strong> also exhibits temporal cluster<strong>in</strong>g, with <strong>in</strong>cidence rates<strong>in</strong>creas<strong>in</strong>g with the onset of the w<strong>in</strong>ter, and dim<strong>in</strong>ish<strong>in</strong>g around the spr<strong>in</strong>g. However, unlessthe risk of victimisation is communicable, one would expect these spatial and temporalclusters to be <strong>in</strong>dependent of each other, with the <strong>in</strong>cidence of new series of <strong>crime</strong> eventsfail<strong>in</strong>g to exhibit localised spatial and temporal <strong>in</strong>creases. Simply put, the communicability ofburglary risk may be demonstrated only by show<strong>in</strong>g that burglary clusters <strong>in</strong> both space andtime. Conformity to this pattern would be evident if houses near the burgled home werevictimised shortly afterwards more than would be expected on the basis of chance. Thosereaders not concerned with technical details on the demonstration of cluster<strong>in</strong>g should skip tothe beg<strong>in</strong>n<strong>in</strong>g of the next chapter at this po<strong>in</strong>t.Empirical research concerned with the space-time cluster<strong>in</strong>g of events was first conducted byKnox (1964) to study epidemics of leukaemia. The rationale underly<strong>in</strong>g the Knox test is todeterm<strong>in</strong>e whether there are more events that occur close <strong>in</strong> space and time than would beexpected on the basis of a random distribution. To do this, each event is compared with everyother and the distance and time between them recorded. For n cases, this generates ½n (n-1) pair<strong>in</strong>gs. A cont<strong>in</strong>gency table, such as shown <strong>in</strong> Table 2.1, with i columns and j rows isthen populated. The spatial and temporal <strong>in</strong>crements (or bandwidths) used <strong>in</strong> the rows andcolumns can be arbitrary, although they should be so def<strong>in</strong>ed as to allow specific hypotheses<strong>in</strong>formed by the underly<strong>in</strong>g theory to be tested. For <strong>in</strong>stance, <strong>in</strong> the case of <strong>crime</strong> the questionconcerns the distance over which <strong>crime</strong> has an impact and for how long? The bandwidthsselected should have relevance to <strong>operational</strong> polic<strong>in</strong>g.Table 2.1: Knox cont<strong>in</strong>gency table example1 month 2 months 3 months …………..100m n 11 n 21 n 31200m n 12 n 22 N 32300m n 13 n 23 N 33400mn 14 n 24 n 34……..……..Note: The mathematical notation n ij refers to the observed frequency for the cell occurr<strong>in</strong>g <strong>in</strong> column i and row j.Thus, n 11 refers to the cell <strong>in</strong> column 1, row 1.The cont<strong>in</strong>gency table generated can be compared with a chance distribution. Onecomplication is that the assumption of <strong>in</strong>dependence of observations, a criterion for most<strong>in</strong>ferential statistical methods, is violated. However, Knox suggested that <strong>in</strong> the absence of aspace-time <strong>in</strong>teraction, the statistical distribution of the expected values for the cells of thecont<strong>in</strong>gency table would conform to a Poisson distribution and could be computed <strong>in</strong> thesame way as a Chi-Square test, us<strong>in</strong>g the marg<strong>in</strong>al totals of the table. Thus,4


