

Prospective crime mapping in operational context Final report
Prospective crime mapping in operational context Final report
Prospective crime mapping in operational context Final report
- No tags were found...

You also want an ePaper? Increase the reach of your titles
YUMPU automatically turns print PDFs into web optimized ePapers that Google loves.
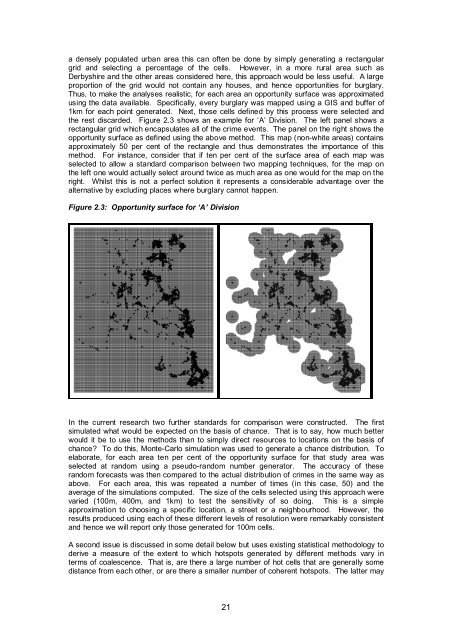
a densely populated urban area this can often be done by simply generat<strong>in</strong>g a rectangulargrid and select<strong>in</strong>g a percentage of the cells. However, <strong>in</strong> a more rural area such asDerbyshire and the other areas considered here, this approach would be less useful. A largeproportion of the grid would not conta<strong>in</strong> any houses, and hence opportunities for burglary.Thus, to make the analyses realistic, for each area an opportunity surface was approximatedus<strong>in</strong>g the data available. Specifically, every burglary was mapped us<strong>in</strong>g a GIS and buffer of1km for each po<strong>in</strong>t generated. Next, those cells def<strong>in</strong>ed by this process were selected andthe rest discarded. Figure 2.3 shows an example for ‘A’ Division. The left panel shows arectangular grid which encapsulates all of the <strong>crime</strong> events. The panel on the right shows theopportunity surface as def<strong>in</strong>ed us<strong>in</strong>g the above method. This map (non-white areas) conta<strong>in</strong>sapproximately 50 per cent of the rectangle and thus demonstrates the importance of thismethod. For <strong>in</strong>stance, consider that if ten per cent of the surface area of each map wasselected to allow a standard comparison between two <strong>mapp<strong>in</strong>g</strong> techniques, for the map onthe left one would actually select around twice as much area as one would for the map on theright. Whilst this is not a perfect solution it represents a considerable advantage over thealternative by exclud<strong>in</strong>g places where burglary cannot happen.Figure 2.3: Opportunity surface for ‘A’ DivisionIn the current research two further standards for comparison were constructed. The firstsimulated what would be expected on the basis of chance. That is to say, how much betterwould it be to use the methods than to simply direct resources to locations on the basis ofchance? To do this, Monte-Carlo simulation was used to generate a chance distribution. Toelaborate, for each area ten per cent of the opportunity surface for that study area wasselected at random us<strong>in</strong>g a pseudo-random number generator. The accuracy of theserandom forecasts was then compared to the actual distribution of <strong>crime</strong>s <strong>in</strong> the same way asabove. For each area, this was repeated a number of times (<strong>in</strong> this case, 50) and theaverage of the simulations computed. The size of the cells selected us<strong>in</strong>g this approach werevaried (100m, 400m, and 1km) to test the sensitivity of so do<strong>in</strong>g. This is a simpleapproximation to choos<strong>in</strong>g a specific location, a street or a neighbourhood. However, theresults produced us<strong>in</strong>g each of these different levels of resolution were remarkably consistentand hence we will <strong>report</strong> only those generated for 100m cells.A second issue is discussed <strong>in</strong> some detail below but uses exist<strong>in</strong>g statistical methodology toderive a measure of the extent to which hotspots generated by different methods vary <strong>in</strong>terms of coalescence. That is, are there a large number of hot cells that are generally somedistance from each other, or are there a smaller number of coherent hotspots. The latter may21


