

Prospective crime mapping in operational context Final report
Prospective crime mapping in operational context Final report
Prospective crime mapping in operational context Final report
- No tags were found...

You also want an ePaper? Increase the reach of your titles
YUMPU automatically turns print PDFs into web optimized ePapers that Google loves.
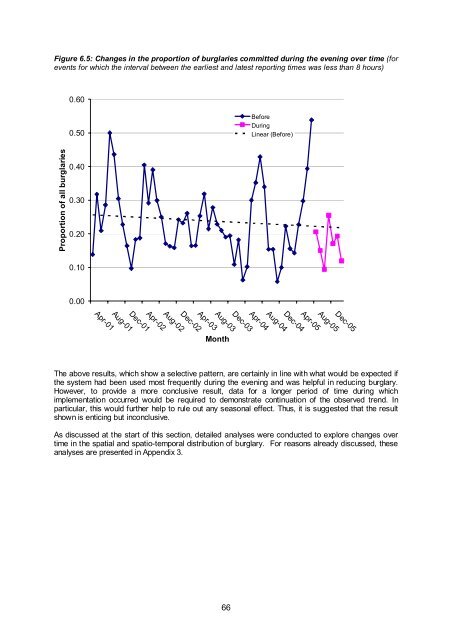
Figure 6.5: Changes <strong>in</strong> the proportion of burglaries committed dur<strong>in</strong>g the even<strong>in</strong>g over time (forevents for which the <strong>in</strong>terval between the earliest and latest <strong>report</strong><strong>in</strong>g times was less than 8 hours)0.600.50BeforeDur<strong>in</strong>gL<strong>in</strong>ear (Before)Proportion of all burglaries0.400.300.200.100.00MonthApr-03Dec-02Aug-02Apr-02Dec-01Aug-01Apr-01Dec-05Aug-05Apr-05Dec-04Aug-04Apr-04Dec-03Aug-03The above results, which show a selective pattern, are certa<strong>in</strong>ly <strong>in</strong> l<strong>in</strong>e with what would be expected ifthe system had been used most frequently dur<strong>in</strong>g the even<strong>in</strong>g and was helpful <strong>in</strong> reduc<strong>in</strong>g burglary.However, to provide a more conclusive result, data for a longer period of time dur<strong>in</strong>g whichimplementation occurred would be required to demonstrate cont<strong>in</strong>uation of the observed trend. Inparticular, this would further help to rule out any seasonal effect. Thus, it is suggested that the resultshown is entic<strong>in</strong>g but <strong>in</strong>conclusive.As discussed at the start of this section, detailed analyses were conducted to explore changes overtime <strong>in</strong> the spatial and spatio-temporal distribution of burglary. For reasons already discussed, theseanalyses are presented <strong>in</strong> Appendix 3.66


