

Prospective crime mapping in operational context Final report
Prospective crime mapping in operational context Final report
Prospective crime mapping in operational context Final report
- No tags were found...

Create successful ePaper yourself
Turn your PDF publications into a flip-book with our unique Google optimized e-Paper software.
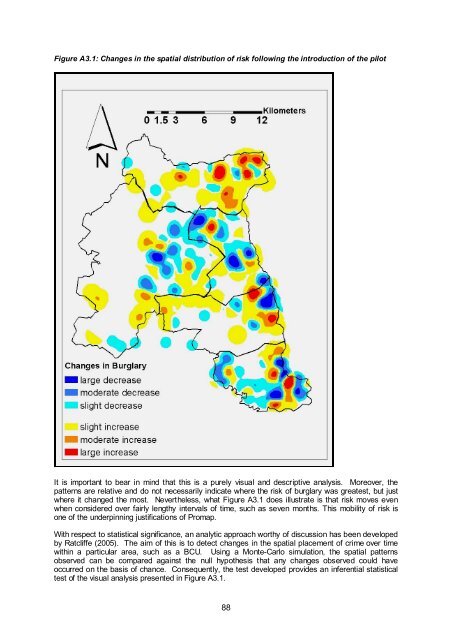
Figure A3.1: Changes <strong>in</strong> the spatial distribution of risk follow<strong>in</strong>g the <strong>in</strong>troduction of the pilotIt is important to bear <strong>in</strong> m<strong>in</strong>d that this is a purely visual and descriptive analysis. Moreover, thepatterns are relative and do not necessarily <strong>in</strong>dicate where the risk of burglary was greatest, but justwhere it changed the most. Nevertheless, what Figure A3.1 does illustrate is that risk moves evenwhen considered over fairly lengthy <strong>in</strong>tervals of time, such as seven months. This mobility of risk isone of the underp<strong>in</strong>n<strong>in</strong>g justifications of Promap.With respect to statistical significance, an analytic approach worthy of discussion has been developedby Ratcliffe (2005). The aim of this is to detect changes <strong>in</strong> the spatial placement of <strong>crime</strong> over timewith<strong>in</strong> a particular area, such as a BCU. Us<strong>in</strong>g a Monte-Carlo simulation, the spatial patternsobserved can be compared aga<strong>in</strong>st the null hypothesis that any changes observed could haveoccurred on the basis of chance. Consequently, the test developed provides an <strong>in</strong>ferential statisticaltest of the visual analysis presented <strong>in</strong> Figure A3.1.88


