

Prospective crime mapping in operational context Final report
Prospective crime mapping in operational context Final report
Prospective crime mapping in operational context Final report
- No tags were found...

You also want an ePaper? Increase the reach of your titles
YUMPU automatically turns print PDFs into web optimized ePapers that Google loves.
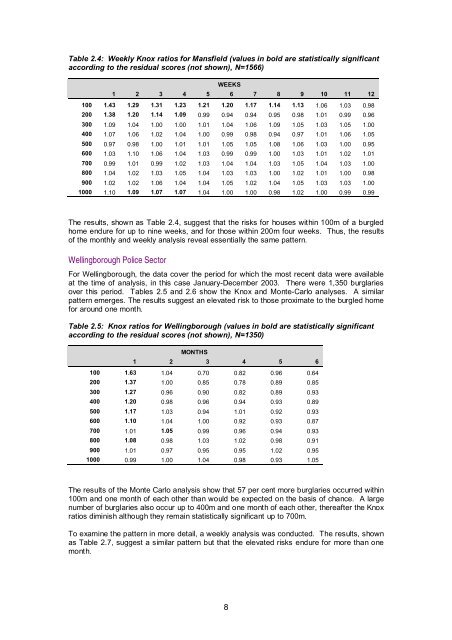
Table 2.4: Weekly Knox ratios for Mansfield (values <strong>in</strong> bold are statistically significantaccord<strong>in</strong>g to the residual scores (not shown), N=1566)WEEKS1 2 3 4 5 6 7 8 9 10 11 12100 1.43 1.29 1.31 1.23 1.21 1.20 1.17 1.14 1.13 1.06 1.03 0.98200 1.38 1.20 1.14 1.09 0.99 0.94 0.94 0.95 0.98 1.01 0.99 0.96300 1.09 1.04 1.00 1.00 1.01 1.04 1.06 1.09 1.05 1.03 1.05 1.00400 1.07 1.06 1.02 1.04 1.00 0.99 0.98 0.94 0.97 1.01 1.06 1.05500 0.97 0.98 1.00 1.01 1.01 1.05 1.05 1.08 1.06 1.03 1.00 0.95600 1.03 1.10 1.06 1.04 1.03 0.99 0.99 1.00 1.03 1.01 1.02 1.01700 0.99 1.01 0.99 1.02 1.03 1.04 1.04 1.03 1.05 1.04 1.03 1.00800 1.04 1.02 1.03 1.05 1.04 1.03 1.03 1.00 1.02 1.01 1.00 0.98900 1.02 1.02 1.06 1.04 1.04 1.05 1.02 1.04 1.05 1.03 1.03 1.001000 1.10 1.09 1.07 1.07 1.04 1.00 1.00 0.98 1.02 1.00 0.99 0.99The results, shown as Table 2.4, suggest that the risks for houses with<strong>in</strong> 100m of a burgledhome endure for up to n<strong>in</strong>e weeks, and for those with<strong>in</strong> 200m four weeks. Thus, the resultsof the monthly and weekly analysis reveal essentially the same pattern.Well<strong>in</strong>gborough Police SectorFor Well<strong>in</strong>gborough, the data cover the period for which the most recent data were availableat the time of analysis, <strong>in</strong> this case January-December 2003. There were 1,350 burglariesover this period. Tables 2.5 and 2.6 show the Knox and Monte-Carlo analyses. A similarpattern emerges. The results suggest an elevated risk to those proximate to the burgled homefor around one month.Table 2.5: Knox ratios for Well<strong>in</strong>gborough (values <strong>in</strong> bold are statistically significantaccord<strong>in</strong>g to the residual scores (not shown), N=1350)MONTHS1 2 3 4 5 6100 1.63 1.04 0.70 0.82 0.96 0.64200 1.37 1.00 0.85 0.78 0.89 0.85300 1.27 0.96 0.90 0.82 0.89 0.93400 1.20 0.98 0.96 0.94 0.93 0.89500 1.17 1.03 0.94 1.01 0.92 0.93600 1.10 1.04 1.00 0.92 0.93 0.87700 1.01 1.05 0.99 0.96 0.94 0.93800 1.08 0.98 1.03 1.02 0.98 0.91900 1.01 0.97 0.95 0.95 1.02 0.951000 0.99 1.00 1.04 0.98 0.93 1.05The results of the Monte Carlo analysis show that 57 per cent more burglaries occurred with<strong>in</strong>100m and one month of each other than would be expected on the basis of chance. A largenumber of burglaries also occur up to 400m and one month of each other, thereafter the Knoxratios dim<strong>in</strong>ish although they rema<strong>in</strong> statistically significant up to 700m.To exam<strong>in</strong>e the pattern <strong>in</strong> more detail, a weekly analysis was conducted. The results, shownas Table 2.7, suggest a similar pattern but that the elevated risks endure for more than onemonth.8


