Guide to COST-BENEFIT ANALYSIS of investment projects - Ramiri
Guide to COST-BENEFIT ANALYSIS of investment projects - Ramiri
Guide to COST-BENEFIT ANALYSIS of investment projects - Ramiri
You also want an ePaper? Increase the reach of your titles
YUMPU automatically turns print PDFs into web optimized ePapers that Google loves.
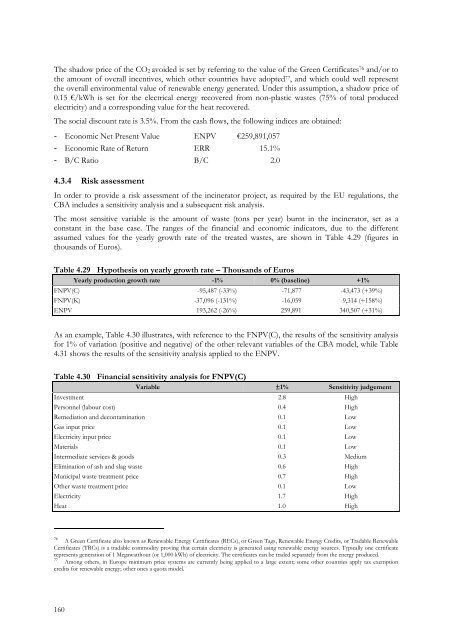
The shadow price <strong>of</strong> the CO 2 avoided is set by referring <strong>to</strong> the value <strong>of</strong> the Green Certificates 76 and/or <strong>to</strong>the amount <strong>of</strong> overall incentives, which other countries have adopted 77 , and which could well representthe overall environmental value <strong>of</strong> renewable energy generated. Under this assumption, a shadow price <strong>of</strong>0.15 €/kWh is set for the electrical energy recovered from non-plastic wastes (75% <strong>of</strong> <strong>to</strong>tal producedelectricity) and a corresponding value for the heat recovered.The social discount rate is 3.5%. From the cash flows, the following indices are obtained:- Economic Net Present Value ENPV €259,891,057- Economic Rate <strong>of</strong> Return ERR 15.1%- B/C Ratio B/C 2.04.3.4 Risk assessmentIn order <strong>to</strong> provide a risk assessment <strong>of</strong> the incinera<strong>to</strong>r project, as required by the EU regulations, theCBA includes a sensitivity analysis and a subsequent risk analysis.The most sensitive variable is the amount <strong>of</strong> waste (<strong>to</strong>ns per year) burnt in the incinera<strong>to</strong>r, set as aconstant in the base case. The ranges <strong>of</strong> the financial and economic indica<strong>to</strong>rs, due <strong>to</strong> the differentassumed values for the yearly growth rate <strong>of</strong> the treated wastes, are shown in Table 4.29 (figures inthousands <strong>of</strong> Euros).Table 4.29 Hypothesis on yearly growth rate – Thousands <strong>of</strong> EurosYearly production growth rate -1% 0% (baseline) +1%FNPV(C) -95,487 (-33%) -71,877 -43,473 (+39%)FNPV(K) -37,096 (-131%) -16,059 9,314 (+158%)ENPV 193,262 (-26%) 259,891 340,507 (+31%)As an example, Table 4.30 illustrates, with reference <strong>to</strong> the FNPV(C), the results <strong>of</strong> the sensitivity analysisfor 1% <strong>of</strong> variation (positive and negative) <strong>of</strong> the other relevant variables <strong>of</strong> the CBA model, while Table4.31 shows the results <strong>of</strong> the sensitivity analysis applied <strong>to</strong> the ENPV.Table 4.30 Financial sensitivity analysis for FNPV(C)Variable ±1% Sensitivity judgementInvestment 2.8 HighPersonnel (labour cost) 0.4 HighRemediation and decontamination 0.1 LowGas input price 0.1 LowElectricity input price 0.1 LowMaterials 0.1 LowIntermediate services & goods 0.3 MediumElimination <strong>of</strong> ash and slag waste 0.6 HighMunicipal waste treatment price 0.7 HighOther waste treatment price 0.1 LowElectricity 1.7 HighHeat 1.0 High76A Green Certificate also known as Renewable Energy Certificates (RECs), or Green Tags, Renewable Energy Credits, or Tradable RenewableCertificates (TRCs) is a tradable commodity proving that certain electricity is generated using renewable energy sources. Typically one certificaterepresents generation <strong>of</strong> 1 Megawatthour (or 1,000 kWh) <strong>of</strong> electricity. The certificates can be traded separately from the energy produced.77Among others, in Europe minimum price systems are currently being applied <strong>to</strong> a large extent; some other countries apply tax exemptioncredits for renewable energy; other ones a quota model.160


