

Guide to COST-BENEFIT ANALYSIS of investment projects - Ramiri
Guide to COST-BENEFIT ANALYSIS of investment projects - Ramiri
Guide to COST-BENEFIT ANALYSIS of investment projects - Ramiri

You also want an ePaper? Increase the reach of your titles
YUMPU automatically turns print PDFs into web optimized ePapers that Google loves.
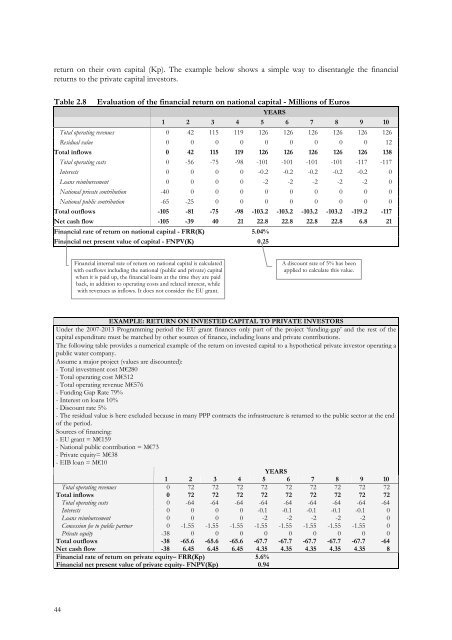
eturn on their own capital (Kp). The example below shows a simple way <strong>to</strong> disentangle the financialreturns <strong>to</strong> the private capital inves<strong>to</strong>rs.Table 2.8Evaluation <strong>of</strong> the financial return on national capital - Millions <strong>of</strong> EurosYEARS1 2 3 4 5 6 7 8 9 10Total operating revenues 0 42 115 119 126 126 126 126 126 126Residual value 0 0 0 0 0 0 0 0 0 12Total inflows 0 42 115 119 126 126 126 126 126 138Total operating costs 0 -56 -75 -98 -101 -101 -101 -101 -117 -117Interests 0 0 0 0 -0.2 -0.2 -0.2 -0.2 -0.2 0Loans reimbursement 0 0 0 0 -2 -2 -2 -2 -2 0National private contribution -40 0 0 0 0 0 0 0 0 0National public contribution -65 -25 0 0 0 0 0 0 0 0Total outflows -105 -81 -75 -98 -103.2 -103.2 -103.2 -103.2 -119.2 -117Net cash flow -105 -39 40 21 22.8 22.8 22.8 22.8 6.8 21Financial rate <strong>of</strong> return on national capital - FRR(K) 5.04%Financial net present value <strong>of</strong> capital - FNPV(K) 0.25Financial internal rate <strong>of</strong> return on national capital is calculatedwith outflows including the national (public and private) capitalwhen it is paid up, the financial loans at the time they are paidback, in addition <strong>to</strong> operating costs and related interest, whilewith revenues as inflows. It does not consider the EU grant.A discount rate <strong>of</strong> 5% has beenapplied <strong>to</strong> calculate this value.EXAMPLE: RETURN ON INVESTED CAPITAL TO PRIVATE INVESTORSUnder the 2007-2013 Programming period the EU grant finances only part <strong>of</strong> the project ‘funding-gap’ and the rest <strong>of</strong> thecapital expenditure must be matched by other sources <strong>of</strong> finance, including loans and private contributions.The following table provides a numerical example <strong>of</strong> the return on invested capital <strong>to</strong> a hypothetical private inves<strong>to</strong>r operating apublic water company.Assume a major project (values are discounted):- Total <strong>investment</strong> cost M€280- Total operating cost M€512- Total operating revenue M€576- Funding Gap Rate 79%- Interest on loans 10%- Discount rate 5%- The residual value is here excluded because in many PPP contracts the infrastructure is returned <strong>to</strong> the public sec<strong>to</strong>r at the end<strong>of</strong> the period.Sources <strong>of</strong> financing:- EU grant = M€159- National public contribution = M€73- Private equity= M€38- EIB loan = M€10YEARS1 2 3 4 5 6 7 8 9 10Total operating revenues 0 72 72 72 72 72 72 72 72 72Total inflows 0 72 72 72 72 72 72 72 72 72Total operating costs 0 -64 -64 -64 -64 -64 -64 -64 -64 -64Interests 0 0 0 0 -0.1 -0.1 -0.1 -0.1 -0.1 0Loans reimbursement 0 0 0 0 -2 -2 -2 -2 -2 0Concession fee <strong>to</strong> public partner 0 -1.55 -1.55 -1.55 -1.55 -1.55 -1.55 -1.55 -1.55 0Private equity -38 0 0 0 0 0 0 0 0 0Total outflows -38 -65.6 -65.6 -65.6 -67.7 -67.7 -67.7 -67.7 -67.7 -64Net cash flow -38 6.45 6.45 6.45 4.35 4.35 4.35 4.35 4.35 8Financial rate <strong>of</strong> return on private equity– FRR(Kp) 5.6%Financial net present value <strong>of</strong> private equity- FNPV(Kp) 0.9444

