Table 4.48 Financial return on national capital (thousands <strong>of</strong> Euros)1 2 3 4 5 6 7 8 9 10 11 12 13 14 15Total municipal services income 0 0 0 10,096 14,662 14,904 15,150 15,401 15,655 15,914 16,177 16,444 16,716 16,992 17,273Industrial and irrigation water supply0 0 0 4,546 6,573 6,653 6,733 6,815 6,898 6,981 7,066 7,152 7,239 7,326 7,415revenueSALES 0 0 0 14,642 21,235 21,557 21,884 22,216 22,553 22,895 23,243 23,596 23,954 24,318 24,688RESIDUAL VALUE 0 0 0 0 0 0 0 0 0 0 0 0 0 0 0TOTAL REVENUES 0 0 0 14,642 21,235 21,557 21,884 22,216 22,553 22,895 23,243 23,596 23,954 24,318 24,688Labour cost 0 0 0 1,494 1,523 1,553 1,583 1,614 1,645 1,677 1,710 1,743 1,777 1,811 1,847Electrical energy 0 0 0 129 188 193 198 203 208 213 218 224 229 235 241Materials (Chemicals, reagents, inert,etc.)0 0 0 2,422 3,525 3,590 3,657 3,725 3,794 3,864 3,936 4,009 4,083 4,159 4,236Intermediate services and goods 0 0 0 3,969 5,762 5,855 5,949 6,045 6,143 6,242 6,343 6,446 6,550 6,656 6,763Maintenance 0 0 0 531 770 782 794 805 818 830 842 855 868 881 894Elimination <strong>of</strong> treatment sludge 0 0 0 2,835 4,137 4,226 4,318 4,411 4,506 4,604 4,703 4,805 4,908 5,015 5,123TOTAL OPERATING <strong>COST</strong>S 0 0 0 11,380 15,905 16,199 16,498 16,803 17,113 17,430 17,752 18,080 18,415 18,756 19,104Bonds and other financial resources 0 0 0 0 0 0 0 0 0 0 0 0 0 0 0EIB loans 0 0 0 0 0 0 0 0 0 0 0 0 0 0 0Other loans 0 0 0 1,232 1,232 1,112 988 865 741 618 494 371 247 124 0INTEREST 0 0 0 1,232 1,232 1,112 988 865 741 618 494 371 247 124 0Bonds and other financial resources 0 0 0 0 0 0 0 0 0 0 0 0 0 0 0EIB loans 0 0 0 0 0 0 0 0 0 0 0 0 0 0 0Other loans 0 0 0 0 2,470 2,470 2,470 2,470 2,470 2,470 2,470 2,470 2,470 2,470 0LOANS REIMBOURSEMENT 0 0 0 0 2,470 2,470 2,470 2,470 2,470 2,470 2,470 2,470 2,470 2,470 0PRIVATE EQUITY 3,018 11,275 10,412 0 0 0 0 0 0 0 0 0 0 0 0National contribution 1,258 10,164 7,607 0 0 0 0 0 0 0 0 0 0 0 0Municipal contribution 1,700 4,495 4,068 0 0 0 0 0 0 0 0 0 0 0 0TOTAL NATIONAL PUBLICCONTRIBUTION2,958 14,659 11,675 0 0 0 0 0 0 0 0 0 0 0 0TOTAL EXPENDITURES 5,976 25,934 22,087 12,612 19,607 19,780 19,956 20,137 20,324 20,517 20,716 20,921 21,132 21,350 19,104NET CASH FLOW -5,976 -25,934 -22,087 2,031 1,628 1,776 1,928 2,078 2,228 2,378 2,527 2,675 2,822 2,968 5,58416 17 18 19 20 21 22 23 24 25 26 27 28 29 30Total municipal services income 17,558 17,848 18,143 18,443 18,747 19,057 19,372 19,692 20,017 20,348 20,684 21,026 21,374 21,727 22,086Industrial and irrigation water supply7,505 7,596 7,688 7,782 7,876 7,971 8,068 8,166 8,265 8,365 8,466 8,568 8,672 8,777 8,883revenueSALES 25,063 25,444 25,831 26,224 26,623 27,028 27,440 27,858 28,282 28,713 29,150 29,595 30,046 30,504 30,969RESIDUAL VALUE 0 0 0 0 0 0 0 0 0 0 0 0 0 0 6,030TOTAL REVENUES 25,063 25,444 25,831 26,224 26,623 27,028 27,440 27,858 28,282 28,713 29,150 29,595 30,046 30,504 36,999Labour cost 1,883 1,919 1,957 1,995 2,033 2,073 2,113 2,154 2,196 2,239 2,283 2,327 2,372 2,419 2,466Electrical energy 247 253 259 266 272 279 286 293 301 308 316 324 332 340 349Materials (Chemicals, reagents, inert,etc.)4,315 4,395 4,477 4,560 4,644 4,730 4,818 4,908 4,999 5,091 5,186 5,282 5,380 5,480 5,582Intermediate services and goods 6,872 6,983 7,096 7,211 7,327 7,446 7,566 7,688 7,813 7,939 8,067 8,198 8,330 8,465 8,601Maintenance 907 921 935 949 963 977 992 1,007 1,022 1,037 1,053 1,069 1,085 1,101 1,118Elimination <strong>of</strong> treatment sludge 5,234 5,347 5,462 5,580 5,701 5,824 5,950 6,078 6,210 6,344 6,481 6,621 6,764 6,910 7,059TOTAL OPERATING <strong>COST</strong>S 19,457 19,818 20,185 20,560 20,941 21,329 21,725 22,129 22,540 22,958 23,385 23,820 24,263 24,714 25,174Bonds and other financial resources 0 0 0 0 0 0 0 0 0 0 0 0 0 0 0EIB loans 0 0 0 0 0 0 0 0 0 0 0 0 0 0 0Other loans 0 0 0 0 0 566 510 453 396 340 283 226 170 113 56INTEREST 0 0 0 0 0 566 510 453 396 340 283 226 170 113 56Bonds and other financial resources 0 0 0 0 0 0 0 0 0 0 0 0 0 0 0EIB loans 0 0 0 0 0 0 0 0 0 0 0 0 0 0 0Other loans 0 0 0 0 0 1,133 1,133 1,133 1,133 1,133 1,133 1,133 1,133 1,133 1,133LOANS REIMBOURSEMENT 0 0 0 0 0 1,133 1,133 1,133 1,133 1,133 1,133 1,133 1,133 1,133 1,133PRIVATE EQUITY 0 0 0 0 11,326 0 0 0 0 0 0 0 0 0 0National contribution 0 0 0 0 0 0 0 0 0 0 0 0 0 0 0Municipal contribution 0 0 0 0 0 0 0 0 0 0 0 0 0 0 0TOTAL NATIONAL PUBLICCONTRIBUTION0 0 0 0 0 0 0 0 0 0 0 0 0 0 0TOTAL EXPENDITURES 19,457 19,818 20,185 20,560 32,267 23,029 23,368 23,715 24,069 24,431 24,801 25,179 25,566 25,960 26,363NET CASH FLOW 5,606 5,626 5,646 5,665 -5,644 4,000 4,072 4,143 4,213 4,281 4,349 4,416 4,480 4,543 10,636Discount Rate 5.0%FNPV(K) -8,357.8FRR(K) 3.7%180
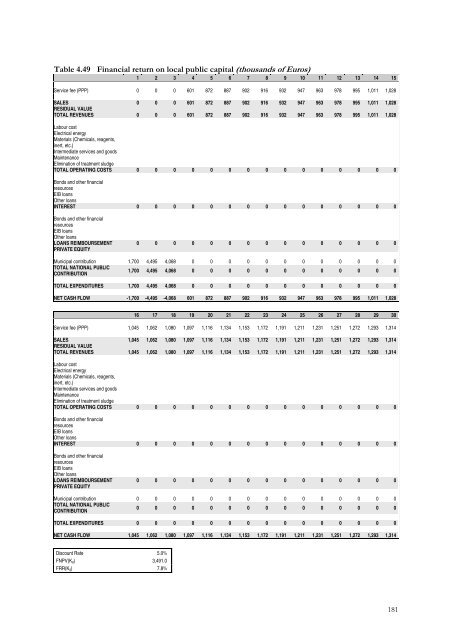
Table 4.49 Financial return on local public capital (thousands <strong>of</strong> Euros)1 2 3 4 5 6 7 8 9 10 11 12 13 14 15Service fee (PPP) 0 0 0 601 872 887 902 916 932 947 963 978 995 1,011 1,028SALES 0 0 0 601 872 887 902 916 932 947 963 978 995 1,011 1,028RESIDUAL VALUETOTAL REVENUES 0 0 0 601 872 887 902 916 932 947 963 978 995 1,011 1,028Labour costElectrical energyMaterials (Chemicals, reagents,inert, etc.)Intermediate services and goodsMaintenanceElimination <strong>of</strong> treatment sludgeTOTAL OPERATING <strong>COST</strong>S 0 0 0 0 0 0 0 0 0 0 0 0 0 0 0Bonds and other financialresourcesEIB loansOther loansINTEREST 0 0 0 0 0 0 0 0 0 0 0 0 0 0 0Bonds and other financialresourcesEIB loansOther loansLOANS REIMBOURSEMENT 0 0 0 0 0 0 0 0 0 0 0 0 0 0 0PRIVATE EQUITYMunicipal contribution 1,700 4,495 4,068 0 0 0 0 0 0 0 0 0 0 0 0TOTAL NATIONAL PUBLICCONTRIBUTION1,700 4,495 4,068 0 0 0 0 0 0 0 0 0 0 0 0TOTAL EXPENDITURES 1,700 4,495 4,068 0 0 0 0 0 0 0 0 0 0 0 0NET CASH FLOW -1,700 -4,495 -4,068 601 872 887 902 916 932 947 963 978 995 1,011 1,02816 17 18 19 20 21 22 23 24 25 26 27 28 29 30Service fee (PPP) 1,045 1,062 1,080 1,097 1,116 1,134 1,153 1,172 1,191 1,211 1,231 1,251 1,272 1,293 1,314SALES 1,045 1,062 1,080 1,097 1,116 1,134 1,153 1,172 1,191 1,211 1,231 1,251 1,272 1,293 1,314RESIDUAL VALUETOTAL REVENUES 1,045 1,062 1,080 1,097 1,116 1,134 1,153 1,172 1,191 1,211 1,231 1,251 1,272 1,293 1,314Labour costElectrical energyMaterials (Chemicals, reagents,inert, etc.)Intermediate services and goodsMaintenanceElimination <strong>of</strong> treatment sludgeTOTAL OPERATING <strong>COST</strong>S 0 0 0 0 0 0 0 0 0 0 0 0 0 0 0Bonds and other financialresourcesEIB loansOther loansINTEREST 0 0 0 0 0 0 0 0 0 0 0 0 0 0 0Bonds and other financialresourcesEIB loansOther loansLOANS REIMBOURSEMENT 0 0 0 0 0 0 0 0 0 0 0 0 0 0 0PRIVATE EQUITYMunicipal contribution 0 0 0 0 0 0 0 0 0 0 0 0 0 0 0TOTAL NATIONAL PUBLICCONTRIBUTION0 0 0 0 0 0 0 0 0 0 0 0 0 0 0TOTAL EXPENDITURES 0 0 0 0 0 0 0 0 0 0 0 0 0 0 0NET CASH FLOW 1,045 1,062 1,080 1,097 1,116 1,134 1,153 1,172 1,191 1,211 1,231 1,251 1,272 1,293 1,314Discount Rate 5.0%FNPV(Kg) 3,491.0FRR(Kg) 7.8%181
- Page 3:
ACRONYMS AND ABBREVIATIONSBAUB/CCBA
- Page 7 and 8:
TABLESTable 2.1 Financial analysis
- Page 9:
FIGURESFigure 1.1 Project cost spre
- Page 12 and 13:
Cohesion Fund, and through the leve
- Page 14 and 15:
or the plant will not reveal excess
- Page 17 and 18:
CHAPTER ONEPROJECT APPRAISAL IN THE
- Page 19 and 20:
Some specifications for financial t
- Page 21 and 22:
FOCUS: INFORMATION REQUIREDGeneral
- Page 23 and 24:
In particular, CBA results should p
- Page 25 and 26:
CHAPTER TWOAN AGENDA FOR THE PROJEC
- Page 27 and 28:
objectives, are, as far as possible
- Page 29 and 30:
considered the appropriate shadow p
- Page 31 and 32:
2.3.2 Feasibility analysisFeasibili
- Page 34 and 35:
This approach will be presented in
- Page 36 and 37:
Current assets include:- receivable
- Page 38 and 39:
The following items are usually not
- Page 40 and 41:
Mainly, the examiner uses the FRR(C
- Page 42 and 43:
The dynamics of the incoming flows
- Page 44 and 45:
eturn on their own capital (Kp). Th
- Page 46 and 47:
While the approach presented in thi
- Page 48 and 49:
2.5.1 Conversion of market to accou
- Page 50 and 51:
Table 2.9 Electricity price dispers
- Page 52 and 53:
2.5.1.2 Fiscal correctionsSome item
- Page 54 and 55:
previously estimated in projects wi
- Page 56 and 57:
FOCUS: ENPV VS. FNPVThe difference
- Page 58 and 59:
2.6 Risk assessmentProject appraisa
- Page 60 and 61:
Table 2.14 Impact analysis of criti
- Page 62 and 63:
Figure 2.6 Probability distribution
- Page 64 and 65:
eneficiary. The project proposer sh
- Page 66 and 67:
There are many ways to design an MC
- Page 68 and 69:
PROJECT APPRAISAL CHECK-LISTCONTEXT
- Page 70 and 71:
- reduction of congestion by elimin
- Page 72 and 73:
- the methods applied to estimate e
- Page 74 and 75:
- the marginal external costs: cong
- Page 76 and 77:
- the benefits for the existing tra
- Page 78 and 79:
The following tables show some refe
- Page 80 and 81:
3.1.1.6 Risk assessmentDue to their
- Page 82 and 83:
As shown in Figure 3.1, only under
- Page 84 and 85:
3.1.3.7 Other project evaluation ap
- Page 87 and 88:
- Waste Management Hierarchy rules
- Page 89 and 90:
The time horizon for a project anal
- Page 91 and 92:
3.2.1.7 Other project evaluation ap
- Page 93 and 94:
every user support the total costs
- Page 95 and 96:
Territorial reference frameworkIf t
- Page 97 and 98:
Cycle and phases of the projectGrea
- Page 99 and 100:
One of the most important aims of t
- Page 101 and 102:
projects, as in other sectors in wh
- Page 103 and 104:
3.2.3.2 Project identificationBasic
- Page 105 and 106:
3.2.3.7 Other project evaluation ap
- Page 107 and 108:
In order to evaluate the overall im
- Page 109 and 110:
for regassification plants, number
- Page 111 and 112:
Examples of objectives are:- change
- Page 113 and 114:
decontamination if any;- the techni
- Page 115 and 116:
3.3.3.6 Risk AnalysisCritical facto
- Page 117 and 118:
3.3.4.6 Risk assessmentCritical fac
- Page 119 and 120:
3.4.1.5 Economic analysisThe follow
- Page 121 and 122:
Financial inflows• Admission fees
- Page 123 and 124:
expectancy suitably adjusted by the
- Page 125 and 126:
The time horizon for project analys
- Page 127 and 128:
A Cost-Benefit Analysis should cons
- Page 129 and 130: CHAPTER FOURCASE STUDIESOverviewThi
- Page 131 and 132: - finally, there is the traffic tha
- Page 134 and 135: c) Road users producer’s surplus:
- Page 136 and 137: 4.1.5 Scenario analysisTwo scenario
- Page 138 and 139: The financial performance indicator
- Page 140 and 141: Table 4.10 Economic analysis (Milli
- Page 142 and 143: Table 4.12 Financial return on capi
- Page 144 and 145: 4.2 Case Study: investment in a rai
- Page 146 and 147: 4.2.4 Economic analysisThe benefits
- Page 148 and 149: Financial investment costs have bee
- Page 150 and 151: Figure 4.6 Results of the risk anal
- Page 152 and 153: Table 4.22 Economic analysis (Milli
- Page 154 and 155: Table 4.24 Financial return on capi
- Page 156 and 157: 4.3 Case Study: investment in an in
- Page 158 and 159: ate of 0.6% per year is assumed for
- Page 160 and 161: The shadow price of the CO 2 avoide
- Page 162 and 163: As a result, the probability distri
- Page 164 and 165: Table 4.36 Financial return on capi
- Page 166 and 167: 16 17 18 19 20 21 22 23 24 25 26 27
- Page 168 and 169: 4.4 Case Study: investment in a was
- Page 170 and 171: 4.4.2 Financial analysisAlthough in
- Page 172 and 173: THE CALCULATION OF REVENUESReferrin
- Page 174 and 175: 0.15 m 3 /m 2 a depreciation of 20%
- Page 176 and 177: As result, the probability distribu
- Page 178 and 179: Figure 4.13 Probability distributio
- Page 182 and 183: Table 4.50 Financial return on priv
- Page 184 and 185: 16 17 18 19 20 21 22 23 24 25 26 27
- Page 186 and 187: 4.5 Case Study: industrial investme
- Page 188 and 189: 4.5.4.1 Investment costsThe total i
- Page 190 and 191: Finally, a residual value was estim
- Page 192 and 193: This analysis shows the need to pay
- Page 194 and 195: Table 4.62 Financial return on inve
- Page 196 and 197: Table 4.64 Return on private equity
- Page 198 and 199: Table 4.66 Economic analysis (thous
- Page 200 and 201: ANNEX ADEMAND ANALYSISDemand foreca
- Page 202 and 203: The method applied for the forecast
- Page 204 and 205: Furthermore, travel demand depends
- Page 206 and 207: This Guide supports a unique refere
- Page 208 and 209: A higher discount rate for countrie
- Page 210 and 211: Figure C.1 Project ranking by NPV v
- Page 212 and 213: The main problems with this indicat
- Page 214 and 215: EXAMPLE OF SHADOW WAGE IN DUAL MARK
- Page 216 and 217: Another exhaustive way to include d
- Page 218 and 219: Figure E.2 Percentage of low income
- Page 220 and 221: ANNEX FEVALUATION OF HEALTH &ENVIRO
- Page 222 and 223: Figure F.1 Main evaluation methodsS
- Page 224 and 225: - expenditure on capital equipment
- Page 226 and 227: due to air pollution or water conta
- Page 228 and 229: BENEFIT TRANSFER - SELECTED REFEREN
- Page 230 and 231:
ANNEX GEVALUATION OF PPP PROJECTSIt
- Page 232 and 233:
adjustments for Competitive Neutral
- Page 234 and 235:
ANNEX HRISK ASSESSMENTIn ex-ante pr
- Page 236 and 237:
Reference ForecastingThe question o
- Page 238 and 239:
Figure H.5 Levels of risks in diffe
- Page 240 and 241:
ANNEX IDETERMINATION OF THE EU GRAN
- Page 242 and 243:
A.4. Technological Alternatives and
- Page 244 and 245:
GLOSSARYAccounting period: the inte
- Page 246 and 247:
Market price: the price at which a
- Page 248 and 249:
BIBLIOGRAPHY1. ReferencesBelli, P.,
- Page 250 and 251:
Ray, A. 1984, Cost-benefit analysis
- Page 252 and 253:
EnvironmentGeneralAtkinson, G., 200
- Page 254 and 255:
European Commission, DG Tren, 2003,