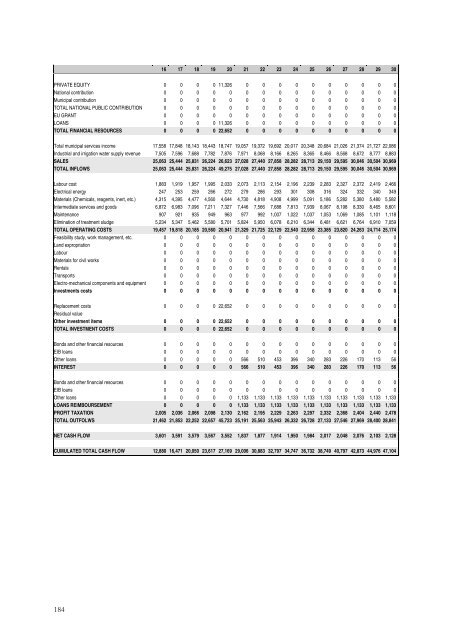
16 17 18 19 20 21 22 23 24 25 26 27 28 29 30PRIVATE EQUITY 0 0 0 0 11,326 0 0 0 0 0 0 0 0 0 0National contribution 0 0 0 0 0 0 0 0 0 0 0 0 0 0 0Municipal contribution 0 0 0 0 0 0 0 0 0 0 0 0 0 0 0TOTAL NATIONAL PUBLIC CONTRIBUTION 0 0 0 0 0 0 0 0 0 0 0 0 0 0 0EU GRANT 0 0 0 0 0 0 0 0 0 0 0 0 0 0 0LOANS 0 0 0 0 11,326 0 0 0 0 0 0 0 0 0 0TOTAL FINANCIAL RESOURCES 0 0 0 0 22,652 0 0 0 0 0 0 0 0 0 0Total municipal services income 17,558 17,848 18,143 18,443 18,747 19,057 19,372 19,692 20,017 20,348 20,684 21,026 21,374 21,727 22,086Industrial and irrigation water supply revenue 7,505 7,596 7,688 7,782 7,876 7,971 8,068 8,166 8,265 8,365 8,466 8,568 8,672 8,777 8,883SALES 25,063 25,444 25,831 26,224 26,623 27,028 27,440 27,858 28,282 28,713 29,150 29,595 30,046 30,504 30,969TOTAL INFLOWS 25,063 25,444 25,831 26,224 49,275 27,028 27,440 27,858 28,282 28,713 29,150 29,595 30,046 30,504 30,969Labour cost 1,883 1,919 1,957 1,995 2,033 2,073 2,113 2,154 2,196 2,239 2,283 2,327 2,372 2,419 2,466Electrical energy 247 253 259 266 272 279 286 293 301 308 316 324 332 340 349Materials (Chemicals, reagents, inert, etc.) 4,315 4,395 4,477 4,560 4,644 4,730 4,818 4,908 4,999 5,091 5,186 5,282 5,380 5,480 5,582Intermediate services and goods 6,872 6,983 7,096 7,211 7,327 7,446 7,566 7,688 7,813 7,939 8,067 8,198 8,330 8,465 8,601Maintenance 907 921 935 949 963 977 992 1,007 1,022 1,037 1,053 1,069 1,085 1,101 1,118Elimination <strong>of</strong> treatment sludge 5,234 5,347 5,462 5,580 5,701 5,824 5,950 6,078 6,210 6,344 6,481 6,621 6,764 6,910 7,059TOTAL OPERATING <strong>COST</strong>S 19,457 19,818 20,185 20,560 20,941 21,329 21,725 22,129 22,540 22,958 23,385 23,820 24,263 24,714 25,174Feasibility study, work management, etc. 0 0 0 0 0 0 0 0 0 0 0 0 0 0 0Land expropriation 0 0 0 0 0 0 0 0 0 0 0 0 0 0 0Labour 0 0 0 0 0 0 0 0 0 0 0 0 0 0 0Materials for civil works 0 0 0 0 0 0 0 0 0 0 0 0 0 0 0Rentals 0 0 0 0 0 0 0 0 0 0 0 0 0 0 0Transports 0 0 0 0 0 0 0 0 0 0 0 0 0 0 0Electro-mechanical components and equipment 0 0 0 0 0 0 0 0 0 0 0 0 0 0 0Investments costs 0 0 0 0 0 0 0 0 0 0 0 0 0 0 0Replacement costs 0 0 0 0 22,652 0 0 0 0 0 0 0 0 0 0Residual valueOther <strong>investment</strong> items 0 0 0 0 22,652 0 0 0 0 0 0 0 0 0 0TOTAL INVESTMENT <strong>COST</strong>S 0 0 0 0 22,652 0 0 0 0 0 0 0 0 0 0Bonds and other financial resources 0 0 0 0 0 0 0 0 0 0 0 0 0 0 0EIB loans 0 0 0 0 0 0 0 0 0 0 0 0 0 0 0Other loans 0 0 0 0 0 566 510 453 396 340 283 226 170 113 56INTEREST 0 0 0 0 0 566 510 453 396 340 283 226 170 113 56Bonds and other financial resources 0 0 0 0 0 0 0 0 0 0 0 0 0 0 0EIB loans 0 0 0 0 0 0 0 0 0 0 0 0 0 0 0Other loans 0 0 0 0 0 1,133 1,133 1,133 1,133 1,133 1,133 1,133 1,133 1,133 1,133LOANS REIMBOURSEMENT 0 0 0 0 0 1,133 1,133 1,133 1,133 1,133 1,133 1,133 1,133 1,133 1,133PROFIT TAXATION 2,005 2,036 2,066 2,098 2,130 2,162 2,195 2,229 2,263 2,297 2,332 2,368 2,404 2,440 2,478TOTAL OUTFOLWS 21,462 21,853 22,252 22,657 45,723 25,191 25,563 25,943 26,332 26,728 27,133 27,546 27,969 28,400 28,841NET CASH FLOW 3,601 3,591 3,579 3,567 3,552 1,837 1,877 1,914 1,950 1,984 2,017 2,048 2,076 2,103 2,128CUMULATED TOTAL CASH FLOW 12,880 16,471 20,050 23,617 27,169 29,006 30,883 32,797 34,747 36,732 38,749 40,797 42,873 44,976 47,104184
Table 4.52 Economic analysis (thousands <strong>of</strong> Euros)CF 1 2 3 4 5 6 7 8 9 10 11 12 13 14 15SALES 0 0 0 0 0 0 0 0 0 0 0 0 0 0 0Wastewater treatment external benefits - 0 0 0 3,680 5,378 5,501 5,627 5,756 5,888 6,022 6,159 6,299 6,442 6,588 6,737Benefit due <strong>to</strong> improvement <strong>of</strong> the production inthe well irrigated area- 0 0 0 18,677 27,082 27,488 27,900 28,319 28,743 29,175 29,612 30,056 30,507 30,965 31,429Savings in groundwater resources - 0 0 0 5,756 8,321 8,420 8,521 8,623 8,726 8,830 8,936 9,043 9,151 9,260 9,371POSITVE EXTERNALITIES 0 0 0 28,112 40,780 41,409 42,048 42,697 43,357 44,027 44,707 45,398 46,100 46,813 47,537TOTAL ECONOMIC <strong>BENEFIT</strong>S 0 0 0 28,112 40,780 41,409 42,048 42,697 43,357 44,027 44,707 45,398 46,100 46,813 47,537Skilled personnel labour cost 1.00 0 0 0 576 588 599 611 624 636 649 662 675 689 703 717Not-skilled personnel labour cost 0.60 0 0 0 551 561 572 583 594 605 617 629 641 653 665 678Electrical energy 0.96 0 0 0 123 180 185 190 194 199 204 209 214 220 225 231Materials (Chemicals, reagents, inert, etc.) 0.80 0 0 0 1,932 2,812 2,864 2,917 2,971 3,026 3,082 3,140 3,198 3,257 3,318 3,379Intermediate services and goods 0.71 0 0 0 2,802 4,067 4,132 4,199 4,267 4,336 4,406 4,477 4,550 4,623 4,698 4,774Maintenance 0.71 0 0 0 375 544 552 560 569 577 586 595 604 613 622 631Elimination <strong>of</strong> treatment sludge 0.80 0 0 0 2,255 3,291 3,363 3,435 3,509 3,585 3,663 3,742 3,823 3,905 3,990 4,076TOTAL OPERATING <strong>COST</strong>S 0 0 0 8,614 12,043 12,267 12,495 12,728 12,965 13,207 13,453 13,704 13,959 14,220 14,485Feasibility study, work management, etc. 1.00 7,363 0 1,896 0 0 0 0 0 0 0 0 0 0 0 0Land expropriation 0.60 435 221 0 0 0 0 0 0 0 0 0 0 0 0 0Labour 0.64 2,723 16,586 8,417 0 0 0 0 0 0 0 0 0 0 0 0Materials for civil works 0.83 821 5,836 3,385 0 0 0 0 0 0 0 0 0 0 0 0Rentals 0.68 18 1,094 1,092 0 0 0 0 0 0 0 0 0 0 0 0Transports 0.68 30 906 889 0 0 0 0 0 0 0 0 0 0 0 0Electro-mechanical components and equipment 0.82 0 9,466 14,412 0 0 0 0 0 0 0 0 0 0 0 0Investments costs 11,391 34,109 30,092 0 0 0 0 0 0 0 0 0 0 0 0Replacement costs 0.82 0 0 0 0 0 0 0 0 0 0 0 0 0 0 0Residual value 0.76 0 0 0 0 0 0 0 0 0 0 0 0 0 0 0Other <strong>investment</strong> items 0 0 0 0 0 0 0 0 0 0 0 0 0 0 0TOTAL INVESTMENT <strong>COST</strong>S 11,391 34,109 30,092 0 0 0 0 0 0 0 0 0 0 0 0Noise, odours, etc. - 0 0 0 617 894 908 921 935 949 963 978 992 1,007 1,022 1,038NEGATIVE EXTERNALITIES 0 0 0 617 894 908 921 935 949 963 978 992 1,007 1,022 1,038TOTAL ECONOMIC <strong>COST</strong>S 11,391 34,109 30,092 9,231 12,937 13,175 13,417 13,663 13,914 14,170 14,431 14,696 14,967 15,242 15,523NET ECONOMIC <strong>BENEFIT</strong>S -11,391 -34,109 -30,092 18,882 27,843 28,235 28,632 29,034 29,443 29,856 30,276 30,702 31,133 31,571 32,014CF 16 17 18 19 20 21 22 23 24 25 26 27 28 29 30SALES 0 0 0 0 0 0 0 0 0 0 0 0 0 0 0Wastewater treatment external benefits - 6,889 7,045 7,204 7,366 7,532 7,701 7,874 8,050 8,231 8,415 8,604 8,796 8,993 9,194 9,400Benefit due <strong>to</strong> improvement <strong>of</strong> the production in thewell irrigated area- 31,901 32,379 32,865 33,358 33,858 34,366 34,882 35,405 35,936 36,475 37,022 37,577 38,141 38,713 39,294Savings in groundwater resources - 9,483 9,596 9,711 9,827 9,945 10,063 10,184 10,306 10,429 10,553 10,680 10,807 10,936 11,067 11,199POSITVE EXTERNALITIES 48,273 49,020 49,779 50,551 51,334 52,130 52,939 53,761 54,596 55,444 56,305 57,181 58,071 58,975 59,893TOTAL ECONOMIC <strong>BENEFIT</strong>S 48,273 49,020 49,779 50,551 51,334 52,130 52,939 53,761 54,596 55,444 56,305 57,181 58,071 58,975 59,893Skilled personnel labour cost 1.00 731 746 761 776 792 808 824 840 857 874 892 910 928 947 966Not-skilled personnel labour cost 0.60 691 704 717 731 745 759 774 789 804 819 834 850 867 883 900Electrical energy 0.96 237 243 249 255 261 268 274 281 288 296 303 311 318 326 334Materials (Chemicals, reagents, inert, etc.) 0.80 3,442 3,506 3,571 3,637 3,705 3,773 3,843 3,915 3,987 4,061 4,137 4,213 4,292 4,371 4,452Intermediate services and goods 0.71 4,851 4,929 5,009 5,090 5,172 5,256 5,340 5,427 5,514 5,604 5,694 5,786 5,880 5,975 6,071Maintenance 0.71 641 650 660 670 680 690 700 711 722 732 743 755 766 777 789Elimination <strong>of</strong> treatment sludge 0.80 4,164 4,254 4,346 4,440 4,536 4,634 4,734 4,836 4,940 5,047 5,156 5,268 5,381 5,498 5,617TOTAL OPERATING <strong>COST</strong>S 14,756 15,031 15,312 15,598 15,890 16,187 16,490 16,798 17,113 17,433 17,760 18,092 18,431 18,777 19,129Feasibility study, work management, etc. 1.00 0 0 0 0 0 0 0 0 0 0 0 0 0 0 0Land expropriation 0.60 0 0 0 0 0 0 0 0 0 0 0 0 0 0 0Labour 0.64 0 0 0 0 0 0 0 0 0 0 0 0 0 0 0Materials for civil works 0.83 0 0 0 0 0 0 0 0 0 0 0 0 0 0 0Rentals 0.68 0 0 0 0 0 0 0 0 0 0 0 0 0 0 0Transports 0.68 0 0 0 0 0 0 0 0 0 0 0 0 0 0 0Electro-mechanical components and equipment 0.82 0 0 0 0 0 0 0 0 0 0 0 0 0 0 0Investments costs 0 0 0 0 0 0 0 0 0 0 0 0 0 0 0Replacement costs 0.82 0 0 0 0 18,563 0 0 0 0 0 0 0 0 0 0Residual value 0.76 0 0 0 0 0 0 0 0 0 0 0 0 0 0 -4,590Other <strong>investment</strong> items 0 0 0 0 18,563 0 0 0 0 0 0 0 0 0 -4,590TOTAL INVESTMENT <strong>COST</strong>S 0 0 0 0 18,563 0 0 0 0 0 0 0 0 0 -4,590Noise, odours, etc. 1,053 1,069 1,085 1,101 1,118 1,135 1,152 1,169 1,187 1,204 1,222 1,241 1,259 1,278 1,297NEGATIVE EXTERNALITIES - 1,053 1,069 1,085 1,101 1,118 1,135 1,152 1,169 1,187 1,204 1,222 1,241 1,259 1,278 1,297TOTAL ECONOMIC <strong>COST</strong>S 15,809 16,101 16,397 16,700 35,570 17,322 17,641 17,967 18,299 18,637 18,982 19,333 19,691 20,055 15,836NET ECONOMIC <strong>BENEFIT</strong>S 32,464 32,920 33,382 33,851 15,764 34,809 35,298 35,793 36,296 36,806 37,324 37,848 38,380 38,920 44,057Discount Rate 5.5%ENPV 295,519.1ERR 28.9%B/C 2.2185
- Page 3:
ACRONYMS AND ABBREVIATIONSBAUB/CCBA
- Page 7 and 8:
TABLESTable 2.1 Financial analysis
- Page 9:
FIGURESFigure 1.1 Project cost spre
- Page 12 and 13:
Cohesion Fund, and through the leve
- Page 14 and 15:
or the plant will not reveal excess
- Page 17 and 18:
CHAPTER ONEPROJECT APPRAISAL IN THE
- Page 19 and 20:
Some specifications for financial t
- Page 21 and 22:
FOCUS: INFORMATION REQUIREDGeneral
- Page 23 and 24:
In particular, CBA results should p
- Page 25 and 26:
CHAPTER TWOAN AGENDA FOR THE PROJEC
- Page 27 and 28:
objectives, are, as far as possible
- Page 29 and 30:
considered the appropriate shadow p
- Page 31 and 32:
2.3.2 Feasibility analysisFeasibili
- Page 34 and 35:
This approach will be presented in
- Page 36 and 37:
Current assets include:- receivable
- Page 38 and 39:
The following items are usually not
- Page 40 and 41:
Mainly, the examiner uses the FRR(C
- Page 42 and 43:
The dynamics of the incoming flows
- Page 44 and 45:
eturn on their own capital (Kp). Th
- Page 46 and 47:
While the approach presented in thi
- Page 48 and 49:
2.5.1 Conversion of market to accou
- Page 50 and 51:
Table 2.9 Electricity price dispers
- Page 52 and 53:
2.5.1.2 Fiscal correctionsSome item
- Page 54 and 55:
previously estimated in projects wi
- Page 56 and 57:
FOCUS: ENPV VS. FNPVThe difference
- Page 58 and 59:
2.6 Risk assessmentProject appraisa
- Page 60 and 61:
Table 2.14 Impact analysis of criti
- Page 62 and 63:
Figure 2.6 Probability distribution
- Page 64 and 65:
eneficiary. The project proposer sh
- Page 66 and 67:
There are many ways to design an MC
- Page 68 and 69:
PROJECT APPRAISAL CHECK-LISTCONTEXT
- Page 70 and 71:
- reduction of congestion by elimin
- Page 72 and 73:
- the methods applied to estimate e
- Page 74 and 75:
- the marginal external costs: cong
- Page 76 and 77:
- the benefits for the existing tra
- Page 78 and 79:
The following tables show some refe
- Page 80 and 81:
3.1.1.6 Risk assessmentDue to their
- Page 82 and 83:
As shown in Figure 3.1, only under
- Page 84 and 85:
3.1.3.7 Other project evaluation ap
- Page 87 and 88:
- Waste Management Hierarchy rules
- Page 89 and 90:
The time horizon for a project anal
- Page 91 and 92:
3.2.1.7 Other project evaluation ap
- Page 93 and 94:
every user support the total costs
- Page 95 and 96:
Territorial reference frameworkIf t
- Page 97 and 98:
Cycle and phases of the projectGrea
- Page 99 and 100:
One of the most important aims of t
- Page 101 and 102:
projects, as in other sectors in wh
- Page 103 and 104:
3.2.3.2 Project identificationBasic
- Page 105 and 106:
3.2.3.7 Other project evaluation ap
- Page 107 and 108:
In order to evaluate the overall im
- Page 109 and 110:
for regassification plants, number
- Page 111 and 112:
Examples of objectives are:- change
- Page 113 and 114:
decontamination if any;- the techni
- Page 115 and 116:
3.3.3.6 Risk AnalysisCritical facto
- Page 117 and 118:
3.3.4.6 Risk assessmentCritical fac
- Page 119 and 120:
3.4.1.5 Economic analysisThe follow
- Page 121 and 122:
Financial inflows• Admission fees
- Page 123 and 124:
expectancy suitably adjusted by the
- Page 125 and 126:
The time horizon for project analys
- Page 127 and 128:
A Cost-Benefit Analysis should cons
- Page 129 and 130:
CHAPTER FOURCASE STUDIESOverviewThi
- Page 131 and 132:
- finally, there is the traffic tha
- Page 134 and 135: c) Road users producer’s surplus:
- Page 136 and 137: 4.1.5 Scenario analysisTwo scenario
- Page 138 and 139: The financial performance indicator
- Page 140 and 141: Table 4.10 Economic analysis (Milli
- Page 142 and 143: Table 4.12 Financial return on capi
- Page 144 and 145: 4.2 Case Study: investment in a rai
- Page 146 and 147: 4.2.4 Economic analysisThe benefits
- Page 148 and 149: Financial investment costs have bee
- Page 150 and 151: Figure 4.6 Results of the risk anal
- Page 152 and 153: Table 4.22 Economic analysis (Milli
- Page 154 and 155: Table 4.24 Financial return on capi
- Page 156 and 157: 4.3 Case Study: investment in an in
- Page 158 and 159: ate of 0.6% per year is assumed for
- Page 160 and 161: The shadow price of the CO 2 avoide
- Page 162 and 163: As a result, the probability distri
- Page 164 and 165: Table 4.36 Financial return on capi
- Page 166 and 167: 16 17 18 19 20 21 22 23 24 25 26 27
- Page 168 and 169: 4.4 Case Study: investment in a was
- Page 170 and 171: 4.4.2 Financial analysisAlthough in
- Page 172 and 173: THE CALCULATION OF REVENUESReferrin
- Page 174 and 175: 0.15 m 3 /m 2 a depreciation of 20%
- Page 176 and 177: As result, the probability distribu
- Page 178 and 179: Figure 4.13 Probability distributio
- Page 180 and 181: Table 4.48 Financial return on nati
- Page 182 and 183: Table 4.50 Financial return on priv
- Page 186 and 187: 4.5 Case Study: industrial investme
- Page 188 and 189: 4.5.4.1 Investment costsThe total i
- Page 190 and 191: Finally, a residual value was estim
- Page 192 and 193: This analysis shows the need to pay
- Page 194 and 195: Table 4.62 Financial return on inve
- Page 196 and 197: Table 4.64 Return on private equity
- Page 198 and 199: Table 4.66 Economic analysis (thous
- Page 200 and 201: ANNEX ADEMAND ANALYSISDemand foreca
- Page 202 and 203: The method applied for the forecast
- Page 204 and 205: Furthermore, travel demand depends
- Page 206 and 207: This Guide supports a unique refere
- Page 208 and 209: A higher discount rate for countrie
- Page 210 and 211: Figure C.1 Project ranking by NPV v
- Page 212 and 213: The main problems with this indicat
- Page 214 and 215: EXAMPLE OF SHADOW WAGE IN DUAL MARK
- Page 216 and 217: Another exhaustive way to include d
- Page 218 and 219: Figure E.2 Percentage of low income
- Page 220 and 221: ANNEX FEVALUATION OF HEALTH &ENVIRO
- Page 222 and 223: Figure F.1 Main evaluation methodsS
- Page 224 and 225: - expenditure on capital equipment
- Page 226 and 227: due to air pollution or water conta
- Page 228 and 229: BENEFIT TRANSFER - SELECTED REFEREN
- Page 230 and 231: ANNEX GEVALUATION OF PPP PROJECTSIt
- Page 232 and 233: adjustments for Competitive Neutral
- Page 234 and 235:
ANNEX HRISK ASSESSMENTIn ex-ante pr
- Page 236 and 237:
Reference ForecastingThe question o
- Page 238 and 239:
Figure H.5 Levels of risks in diffe
- Page 240 and 241:
ANNEX IDETERMINATION OF THE EU GRAN
- Page 242 and 243:
A.4. Technological Alternatives and
- Page 244 and 245:
GLOSSARYAccounting period: the inte
- Page 246 and 247:
Market price: the price at which a
- Page 248 and 249:
BIBLIOGRAPHY1. ReferencesBelli, P.,
- Page 250 and 251:
Ray, A. 1984, Cost-benefit analysis
- Page 252 and 253:
EnvironmentGeneralAtkinson, G., 200
- Page 254 and 255:
European Commission, DG Tren, 2003,