

Guide to COST-BENEFIT ANALYSIS of investment projects - Ramiri
Guide to COST-BENEFIT ANALYSIS of investment projects - Ramiri
Guide to COST-BENEFIT ANALYSIS of investment projects - Ramiri

You also want an ePaper? Increase the reach of your titles
YUMPU automatically turns print PDFs into web optimized ePapers that Google loves.
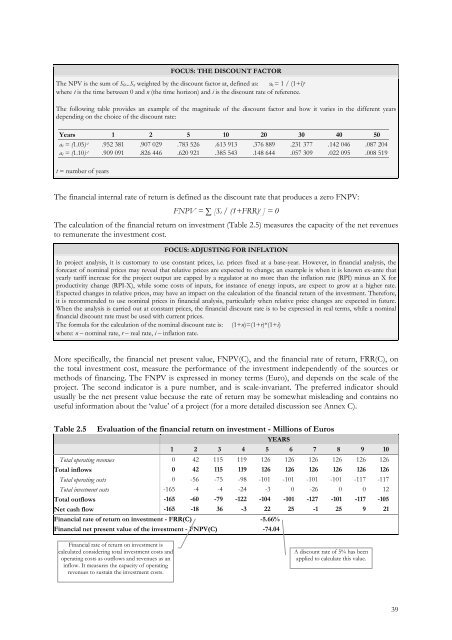
FOCUS: THE DISCOUNT FACTORThe NPV is the sum <strong>of</strong> S 0 ...S n weighted by the discount fac<strong>to</strong>r at, defined as: a t = 1 / (1+i) twhere t is the time between 0 and n (the time horizon) and i is the discount rate <strong>of</strong> reference.The following table provides an example <strong>of</strong> the magnitude <strong>of</strong> the discount fac<strong>to</strong>r and how it varies in the different yearsdepending on the choice <strong>of</strong> the discount rate:Years 1 2 5 10 20 30 40 50a t = (1.05) -t .952 381 .907 029 .783 526 .613 913 .376 889 .231 377 .142 046 .087 204a t = (1.10) -t .909 091 .826 446 .620 921 .385 543 .148 644 .057 309 .022 095 .008 519t = number <strong>of</strong> yearsThe financial internal rate <strong>of</strong> return is defined as the discount rate that produces a zero FNPV:FNPV = ∑ [S t / (1+FRR) t ] = 0The calculation <strong>of</strong> the financial return on <strong>investment</strong> (Table 2.5) measures the capacity <strong>of</strong> the net revenues<strong>to</strong> remunerate the <strong>investment</strong> cost.FOCUS: ADJUSTING FOR INFLATIONIn project analysis, it is cus<strong>to</strong>mary <strong>to</strong> use constant prices, i.e. prices fixed at a base-year. However, in financial analysis, theforecast <strong>of</strong> nominal prices may reveal that relative prices are expected <strong>to</strong> change; an example is when it is known ex-ante thatyearly tariff increase for the project output are capped by a regula<strong>to</strong>r at no more than the inflation rate (RPI) minus an X forproductivity change (RPI-X), while some costs <strong>of</strong> inputs, for instance <strong>of</strong> energy inputs, are expect <strong>to</strong> grow at a higher rate.Expected changes in relative prices, may have an impact on the calculation <strong>of</strong> the financial return <strong>of</strong> the <strong>investment</strong>. Therefore,it is recommended <strong>to</strong> use nominal prices in financial analysis, particularly when relative price changes are expected in future.When the analysis is carried out at constant prices, the financial discount rate is <strong>to</strong> be expressed in real terms, while a nominalfinancial discount rate must be used with current prices.The formula for the calculation <strong>of</strong> the nominal discount rate is: (1+n)=(1+r)*(1+i)where: n – nominal rate, r – real rate, i – inflation rate.More specifically, the financial net present value, FNPV(C), and the financial rate <strong>of</strong> return, FRR(C), onthe <strong>to</strong>tal <strong>investment</strong> cost, measure the performance <strong>of</strong> the <strong>investment</strong> independently <strong>of</strong> the sources ormethods <strong>of</strong> financing. The FNPV is expressed in money terms (Euro), and depends on the scale <strong>of</strong> theproject. The second indica<strong>to</strong>r is a pure number, and is scale-invariant. The preferred indica<strong>to</strong>r shouldusually be the net present value because the rate <strong>of</strong> return may be somewhat misleading and contains nouseful information about the ‘value’ <strong>of</strong> a project (for a more detailed discussion see Annex C).Table 2.5 Evaluation <strong>of</strong> the financial return on <strong>investment</strong> - Millions <strong>of</strong> EurosYEARS1 2 3 4 5 6 7 8 9 10Total operating revenues 0 42 115 119 126 126 126 126 126 126Total inflows 0 42 115 119 126 126 126 126 126 126Total operating costs 0 -56 -75 -98 -101 -101 -101 -101 -117 -117Total <strong>investment</strong> costs -165 -4 -4 -24 -3 0 -26 0 0 12Total outflows -165 -60 -79 -122 -104 -101 -127 -101 -117 -105Net cash flow -165 -18 36 -3 22 25 -1 25 9 21Financial rate <strong>of</strong> return on <strong>investment</strong> - FRR(C) -5.66%Financial net present value <strong>of</strong> the <strong>investment</strong> - FNPV(C) -74.04Financial rate <strong>of</strong> return on <strong>investment</strong> iscalculated considering <strong>to</strong>tal <strong>investment</strong> costs andoperating costs as outflows and revenues as aninflow. It measures the capacity <strong>of</strong> operatingrevenues <strong>to</strong> sustain the <strong>investment</strong> costs.A discount rate <strong>of</strong> 5% has beenapplied <strong>to</strong> calculate this value.39

