

Guide to COST-BENEFIT ANALYSIS of investment projects - Ramiri
Guide to COST-BENEFIT ANALYSIS of investment projects - Ramiri
Guide to COST-BENEFIT ANALYSIS of investment projects - Ramiri

Create successful ePaper yourself
Turn your PDF publications into a flip-book with our unique Google optimized e-Paper software.
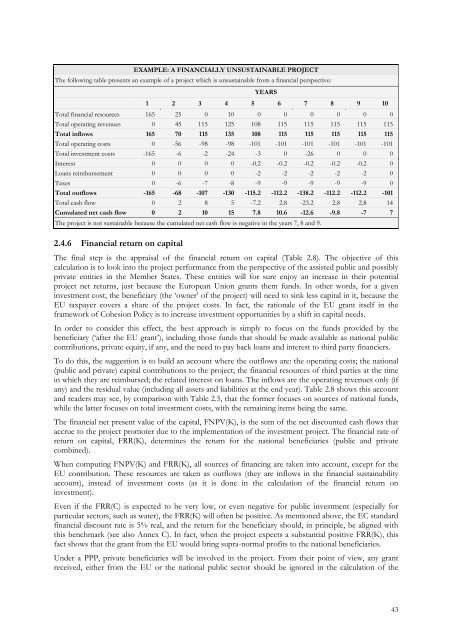
EXAMPLE: A FINANCIALLY UNSUSTAINABLE PROJECTThe following table presents an example <strong>of</strong> a project which is unsustainable from a financial perspective:YEARS1 2 3 4 5 6 7 8 9 10Total financial resources 165 25 0 10 0 0 0 0 0 0Total operating revenues 0 45 115 125 108 115 115 115 115 115Total inflows 165 70 115 135 108 115 115 115 115 115Total operating costs 0 -56 -98 -98 -101 -101 -101 -101 -101 -101Total <strong>investment</strong> costs -165 -6 -2 -24 -3 0 -26 0 0 0Interest 0 0 0 0 -0.2 -0.2 -0.2 -0.2 -0.2 0Loans reimbursement 0 0 0 0 -2 -2 -2 -2 -2 0Taxes 0 -6 -7 -8 -9 -9 -9 -9 -9 0Total outflows -165 -68 -107 -130 -115.2 -112.2 -138.2 -112.2 -112.2 -101Total cash flow 0 2 8 5 -7.2 2.8 -23.2 2.8 2.8 14Cumulated net cash flow 0 2 10 15 7.8 10.6 -12.6 -9.8 -7 7The project is not sustainable because the cumulated net cash flow is negative in the years 7, 8 and 9.2.4.6 Financial return on capitalThe final step is the appraisal <strong>of</strong> the financial return on capital (Table 2.8). The objective <strong>of</strong> thiscalculation is <strong>to</strong> look in<strong>to</strong> the project performance from the perspective <strong>of</strong> the assisted public and possiblyprivate entities in the Member States. These entities will for sure enjoy an increase in their potentialproject net returns, just because the European Union grants them funds. In other words, for a given<strong>investment</strong> cost, the beneficiary (the ‘owner’ <strong>of</strong> the project) will need <strong>to</strong> sink less capital in it, because theEU taxpayer covers a share <strong>of</strong> the project costs. In fact, the rationale <strong>of</strong> the EU grant itself in theframework <strong>of</strong> Cohesion Policy is <strong>to</strong> increase <strong>investment</strong> opportunities by a shift in capital needs.In order <strong>to</strong> consider this effect, the best approach is simply <strong>to</strong> focus on the funds provided by thebeneficiary (‘after the EU grant’), including those funds that should be made available as national publiccontributions, private equity, if any, and the need <strong>to</strong> pay back loans and interest <strong>to</strong> third party financiers.To do this, the suggestion is <strong>to</strong> build an account where the outflows are: the operating costs; the national(public and private) capital contributions <strong>to</strong> the project; the financial resources <strong>of</strong> third parties at the timein which they are reimbursed; the related interest on loans. The inflows are the operating revenues only (ifany) and the residual value (including all assets and liabilities at the end year). Table 2.8 shows this accountand readers may see, by comparison with Table 2.5, that the former focuses on sources <strong>of</strong> national funds,while the latter focuses on <strong>to</strong>tal <strong>investment</strong> costs, with the remaining items being the same.The financial net present value <strong>of</strong> the capital, FNPV(K), is the sum <strong>of</strong> the net discounted cash flows thataccrue <strong>to</strong> the project promoter due <strong>to</strong> the implementation <strong>of</strong> the <strong>investment</strong> project. The financial rate <strong>of</strong>return on capital, FRR(K), determines the return for the national beneficiaries (public and privatecombined).When computing FNPV(K) and FRR(K), all sources <strong>of</strong> financing are taken in<strong>to</strong> account, except for theEU contribution. These resources are taken as outflows (they are inflows in the financial sustainabilityaccount), instead <strong>of</strong> <strong>investment</strong> costs (as it is done in the calculation <strong>of</strong> the financial return on<strong>investment</strong>).Even if the FRR(C) is expected <strong>to</strong> be very low, or even negative for public <strong>investment</strong> (especially forparticular sec<strong>to</strong>rs, such as water), the FRR(K) will <strong>of</strong>ten be positive. As mentioned above, the EC standardfinancial discount rate is 5% real, and the return for the beneficiary should, in principle, be aligned withthis benchmark (see also Annex C). In fact, when the project expects a substantial positive FRR(K), thisfact shows that the grant from the EU would bring supra-normal pr<strong>of</strong>its <strong>to</strong> the national beneficiaries.Under a PPP, private beneficiaries will be involved in the project. From their point <strong>of</strong> view, any grantreceived, either from the EU or the national public sec<strong>to</strong>r should be ignored in the calculation <strong>of</strong> the43

