

Guide to COST-BENEFIT ANALYSIS of investment projects - Ramiri
Guide to COST-BENEFIT ANALYSIS of investment projects - Ramiri
Guide to COST-BENEFIT ANALYSIS of investment projects - Ramiri

You also want an ePaper? Increase the reach of your titles
YUMPU automatically turns print PDFs into web optimized ePapers that Google loves.
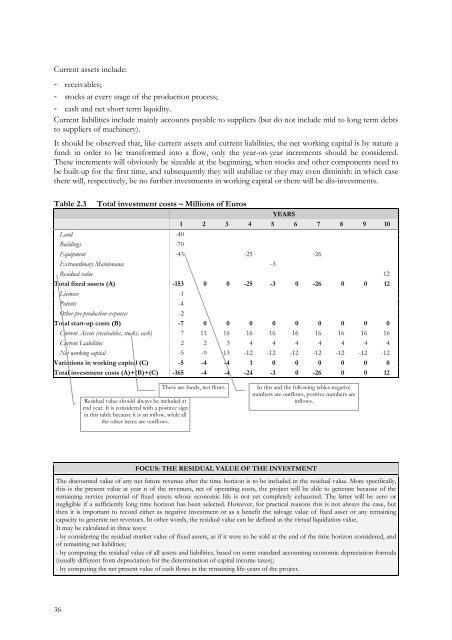
Current assets include:- receivables;- s<strong>to</strong>cks at every stage <strong>of</strong> the production process;- cash and net short term liquidity.Current liabilities include mainly accounts payable <strong>to</strong> suppliers (but do not include mid <strong>to</strong> long term debts<strong>to</strong> suppliers <strong>of</strong> machinery).It should be observed that, like current assets and current liabilities, the net working capital is by nature afund: in order <strong>to</strong> be transformed in<strong>to</strong> a flow, only the year-on-year increments should be considered.These increments will obviously be sizeable at the beginning, when s<strong>to</strong>cks and other components need <strong>to</strong>be built-up for the first time, and subsequently they will stabilize or they may even diminish: in which casethere will, respectively, be no further <strong>investment</strong>s in working capital or there will be dis-<strong>investment</strong>s.Table 2.3 Total <strong>investment</strong> costs – Millions <strong>of</strong> EurosYEARS1 2 3 4 5 6 7 8 9 10Land -40Buildings -70Equipment -43 -25 -26Extraordinary Maintenance -3Residual value 12Total fixed assets (A) -153 0 0 -25 -3 0 -26 0 0 12Licences -1Patents -4Other pre-production expenses -2Total start-up costs (B) -7 0 0 0 0 0 0 0 0 0Current Assets (receivables, s<strong>to</strong>cks, cash) 7 11 16 16 16 16 16 16 16 16Current Liabilities 2 2 3 4 4 4 4 4 4 4Net working capital -5 -9 -13 -12 -12 -12 -12 -12 -12 -12Variations in working capital (C) -5 -4 -4 1 0 0 0 0 0 0Total <strong>investment</strong> costs (A)+(B)+(C) -165 -4 -4 -24 -3 0 -26 0 0 12Residual value should always be included atend year. It is considered with a positive signin this table because it is an inflow, while allthe other items are outflows.These are funds, not flows.In this and the following tables negativenumbers are outflows, positive numbers areinflows.FOCUS: THE RESIDUAL VALUE OF THE INVESTMENTThe discounted value <strong>of</strong> any net future revenue after the time horizon is <strong>to</strong> be included in the residual value. More specifically,this is the present value at year n <strong>of</strong> the revenues, net <strong>of</strong> operating costs, the project will be able <strong>to</strong> generate because <strong>of</strong> theremaining service potential <strong>of</strong> fixed assets whose economic life is not yet completely exhausted. The latter will be zero ornegligible if a sufficiently long time horizon has been selected. However, for practical reasons this is not always the case, butthen it is important <strong>to</strong> record either as negative <strong>investment</strong> or as a benefit the salvage value <strong>of</strong> fixed asset or any remainingcapacity <strong>to</strong> generate net revenues. In other words, the residual value can be defined as the virtual liquidation value.It may be calculated in three ways:- by considering the residual market value <strong>of</strong> fixed assets, as if it were <strong>to</strong> be sold at the end <strong>of</strong> the time horizon considered, and<strong>of</strong> remaining net liabilities;- by computing the residual value <strong>of</strong> all assets and liabilities, based on some standard accounting economic depreciation formula(usually different from depreciation for the determination <strong>of</strong> capital income taxes);- by computing the net present value <strong>of</strong> cash flows in the remaining life-years <strong>of</strong> the project.36

