Handbook for Methane Control in Mining - AMMSA
Handbook for Methane Control in Mining - AMMSA
Handbook for Methane Control in Mining - AMMSA

You also want an ePaper? Increase the reach of your titles
YUMPU automatically turns print PDFs into web optimized ePapers that Google loves.
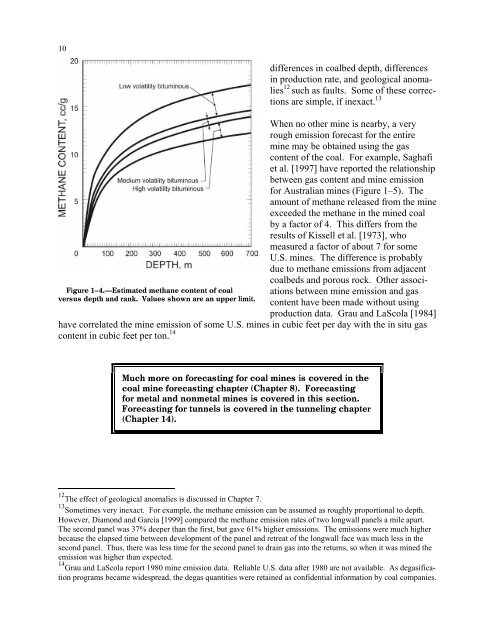
10Figure 1–4.—Estimated methane content of coalversus depth and rank. Values shown are an upper limit.differences <strong>in</strong> coalbed depth, differences<strong>in</strong> production rate, and geological anomalies12 such as faults. Some of these correctionsare simple, if <strong>in</strong>exact. 13When no other m<strong>in</strong>e is nearby, a veryrough emission <strong>for</strong>ecast <strong>for</strong> the entirem<strong>in</strong>e may be obta<strong>in</strong>ed us<strong>in</strong>g the gascontent of the coal. For example, Saghafiet al. [1997] have reported the relationshipbetween gas content and m<strong>in</strong>e emission<strong>for</strong> Australian m<strong>in</strong>es (Figure 1–5). Theamount of methane released from the m<strong>in</strong>eexceeded the methane <strong>in</strong> the m<strong>in</strong>ed coalby a factor of 4. This differs from theresults of Kissell et al. [1973], whomeasured a factor of about 7 <strong>for</strong> someU.S. m<strong>in</strong>es. The difference is probablydue to methane emissions from adjacentcoalbeds and porous rock. Other associationsbetween m<strong>in</strong>e emission and gascontent have been made without us<strong>in</strong>gproduction data. Grau and LaScola [1984]have correlated the m<strong>in</strong>e emission of some U.S. m<strong>in</strong>es <strong>in</strong> cubic feet per day with the <strong>in</strong> situ gascontent <strong>in</strong> cubic feet per ton. 14Much more on <strong>for</strong>ecast<strong>in</strong>g <strong>for</strong> coal m<strong>in</strong>es is covered <strong>in</strong> thecoal m<strong>in</strong>e <strong>for</strong>ecast<strong>in</strong>g chapter (Chapter 8). Forecast<strong>in</strong>g<strong>for</strong> metal and nonmetal m<strong>in</strong>es is covered <strong>in</strong> this section.Forecast<strong>in</strong>g <strong>for</strong> tunnels is covered <strong>in</strong> the tunnel<strong>in</strong>g chapter(Chapter 14).12 The effect of geological anomalies is discussed <strong>in</strong> Chapter 7.13 Sometimes very <strong>in</strong>exact. For example, the methane emission can be assumed as roughly proportional to depth.However, Diamond and Garcia [1999] compared the methane emission rates of two longwall panels a mile apart.The second panel was 37% deeper than the first, but gave 61% higher emissions. The emissions were much higherbecause the elapsed time between development of the panel and retreat of the longwall face was much less <strong>in</strong> thesecond panel. Thus, there was less time <strong>for</strong> the second panel to dra<strong>in</strong> gas <strong>in</strong>to the returns, so when it was m<strong>in</strong>ed theemission was higher than expected.14 Grau and LaScola report 1980 m<strong>in</strong>e emission data. Reliable U.S. data after 1980 are not available. As degasificationprograms became widespread, the degas quantities were reta<strong>in</strong>ed as confidential <strong>in</strong><strong>for</strong>mation by coal companies.