

2015 DETROIT LIONS MEDIA GUIDE
1QYXoLC
1QYXoLC

You also want an ePaper? Increase the reach of your titles
YUMPU automatically turns print PDFs into web optimized ePapers that Google loves.
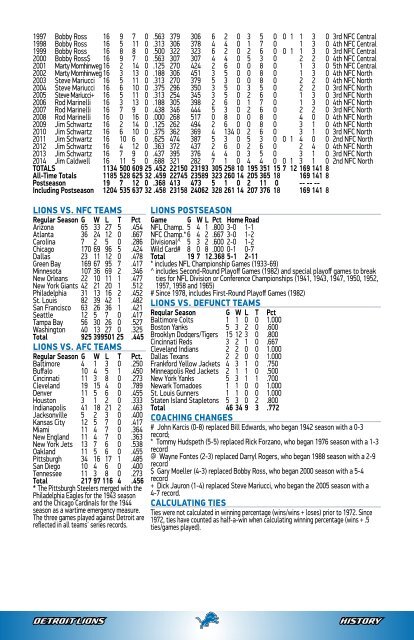
1997 Bobby Ross 16 9 7 0 .563 379 306 6 2 0 3 5 0 0 1 1 3 0 3rd NFC Central<br />
1998 Bobby Ross 16 5 11 0 .313 306 378 4 4 0 1 7 0 1 3 0 4th NFC Central<br />
1999 Bobby Ross 16 8 8 0 .500 322 323 6 2 0 2 6 0 0 1 1 3 0 3rd NFC Central<br />
2000 Bobby Ross$ 16 9 7 0 .563 307 307 4 4 0 5 3 0 2 2 0 4th NFC Central<br />
2001 Marty Mornhinweg 16 2 14 0 .125 270 424 2 6 0 0 8 0 1 3 0 5th NFC Central<br />
2002 Marty Mornhinweg 16 3 13 0 .188 306 451 3 5 0 0 8 0 1 3 0 4th NFC North<br />
2003 Steve Mariucci 16 5 11 0 .313 270 379 5 3 0 0 8 0 2 2 0 4th NFC North<br />
2004 Steve Mariucci 16 6 10 0 .375 296 350 3 5 0 3 5 0 2 2 0 3rd NFC North<br />
2005 Steve Mariucci+ 16 5 11 0 .313 254 345 3 5 0 2 6 0 1 3 0 3rd NFC North<br />
2006 Rod Marinelli 16 3 13 0 .188 305 398 2 6 0 1 7 0 1 3 0 4th NFC North<br />
2007 Rod Marinelli 16 7 9 0 .438 346 444 5 3 0 2 6 0 2 2 0 3rd NFC North<br />
2008 Rod Marinelli 16 0 16 0 .000 268 517 0 8 0 0 8 0 4 0 0 4th NFC North<br />
2009 Jim Schwartz 16 2 14 0 .125 262 494 2 6 0 0 8 0 3 1 0 4th NFC North<br />
2010 Jim Schwartz 16 6 10 0 .375 362 369 4 134 0 2 6 0 3 1 0 3rd NFC North<br />
2011 Jim Schwartz 16 10 6 0 .625 474 387 5 3 0 5 3 0 0 1 4 0 0 2nd NFC North<br />
2012 Jim Schwartz 16 4 12 0 .363 372 437 2 6 0 2 6 0 2 4 0 4th NFC North<br />
2013 Jim Schwartz 16 7 9 0 .437 395 376 4 4 0 3 5 0 3 1 0 3rd NFC North<br />
2014 Jim Caldwell 16 11 5 0 .688 321 282 7 1 0 4 4 0 0 1 3 1 0 2nd NFC North<br />
TOTALS 1134 500 609 25 .452 22150 23193 305 258 10 195 351 15 7 12 169 141 8<br />
All-Time Totals 1185 528 625 32 .459 22745 23589 323 260 14 205 365 18 169 141 8<br />
Postseason 19 7 12 0 .368 413 473 5 1 0 2 11 0 -- -- --<br />
Including Postseason 1204 535 637 32 .458 23158 24062 328 261 14 207 376 18 169 141 8<br />
<strong>LIONS</strong> VS. NFC TEAMS<br />
Regular Season G W L T Pct<br />
Arizona 65 33 27 5 .454<br />
Atlanta 36 24 12 0 .667<br />
Carolina 7 2 5 0 .286<br />
Chicago 170 69 96 5 .424<br />
Dallas 23 11 12 0 .478<br />
Green Bay 169 67 95 7 .417<br />
Minnesota 107 36 69 2 .346<br />
New Orleans 22 10 11 1 .477<br />
New York Giants 42 21 20 1 .512<br />
Philadelphia 31 13 16 2 .452<br />
St. Louis 82 39 42 1 .482<br />
San Francisco 63 26 36 1 .421<br />
Seattle 12 5 7 0 .417<br />
Tampa Bay 56 30 26 0 .527<br />
Washington 40 13 27 0 .325<br />
Total 925 399501 25 .445<br />
<strong>LIONS</strong> VS. AFC TEAMS<br />
Regular Season G W L T Pct.<br />
Baltimore 4 1 3 0 .250<br />
Buffalo 10 4 5 1 .450<br />
Cincinnati 11 3 8 0 .273<br />
Cleveland 19 15 4 0 .789<br />
Denver 11 5 6 0 .455<br />
Houston 3 1 2 0 .333<br />
Indianapolis 41 18 21 2 .463<br />
Jacksonville 5 2 3 0 .400<br />
Kansas City 12 5 7 0 .417<br />
Miami 11 4 7 0 .364<br />
New England 11 4 7 0 .363<br />
New York Jets 13 7 6 0 .538<br />
Oakland 11 5 6 0 .455<br />
Pittsburgh 34 16 17 1 .485<br />
San Diego 10 4 6 0 .400<br />
Tennessee 11 3 8 0 .273<br />
Total 217 97 116 4 .456<br />
* The Pittsburgh Steelers merged with the<br />
Philadelphia Eagles for the 1943 season<br />
and the Chicago Cardinals for the 1944<br />
season as a wartime emergency measure.<br />
The three games played against Detroit are<br />
reflected in all teams' series records.<br />
<strong>LIONS</strong> POSTSEASON<br />
Game G W L Pct Home Road<br />
NFL Champ. 5 4 1 .800 3-0 1-1<br />
NFC Champ.* 6 4 2 .667 3-0 1-2<br />
Divisional^ 5 3 2 .600 2-0 1-2<br />
Wild Card# 8 0 8 .000 0-1 0-7<br />
Total 19 7 12.368 5-1 2-11<br />
* includes NFL Championship Games (1933-69)<br />
^ includes Second-Round Playoff Games (1982) and special playoff games to break<br />
ties for NFL Division or Conference Championships (1941, 1943, 1947, 1950, 1952,<br />
1957, 1958 and 1965)<br />
# Since 1978, includes First-Round Playoff Games (1982)<br />
<strong>LIONS</strong> VS. DEFUNCT TEAMS<br />
Regular Season G W L T Pct<br />
Baltimore Colts 1 1 0 0 1.000<br />
Boston Yanks 5 3 2 0 .600<br />
Brooklyn Dodgers/Tigers 15 12 3 0 .800<br />
Cincinnati Reds 3 2 1 0 .667<br />
Cleveland Indians 2 2 0 0 1.000<br />
Dallas Texans 2 2 0 0 1.000<br />
Frankford Yellow Jackets 4 3 1 0 .750<br />
Minneapolis Red Jackets 2 1 1 0 .500<br />
New York Yanks 5 3 1 1 .700<br />
Newark Tornadoes 1 1 0 0 1.000<br />
St. Louis Gunners 1 1 0 0 1.000<br />
Staten Island Stapletons 5 3 0 2 .800<br />
Total 46 34 9 3 .772<br />
COACHING CHANGES<br />
# John Karcis (0-8) replaced Bill Edwards, who began 1942 season with a 0-3<br />
record;<br />
* Tommy Hudspeth (5-5) replaced Rick Forzano, who began 1976 season with a 1-3<br />
record<br />
@ Wayne Fontes (2-3) replaced Darryl Rogers, who began 1988 season with a 2-9<br />
record<br />
$ Gary Moeller (4-3) replaced Bobby Ross, who began 2000 season with a 5-4<br />
record<br />
+ Dick Jauron (1-4) replaced Steve Mariucci, who began the 2005 season with a<br />
4-7 record.<br />
CALCULATING TIES<br />
Ties were not calculated in winning percentage (wins/wins + loses) prior to 1972. Since<br />
1972, ties have counted as half-a-win when calculating winning percentage (wins + .5<br />
ties/games played).<br />
<strong>DETROIT</strong> <strong>LIONS</strong><br />
HISTORY