PDF 25 MB - Sun International | Investor Centre
PDF 25 MB - Sun International | Investor Centre
PDF 25 MB - Sun International | Investor Centre

Create successful ePaper yourself
Turn your PDF publications into a flip-book with our unique Google optimized e-Paper software.
SUN INTERNATIONAL ANNUAL REPORT ’10<br />
120<br />
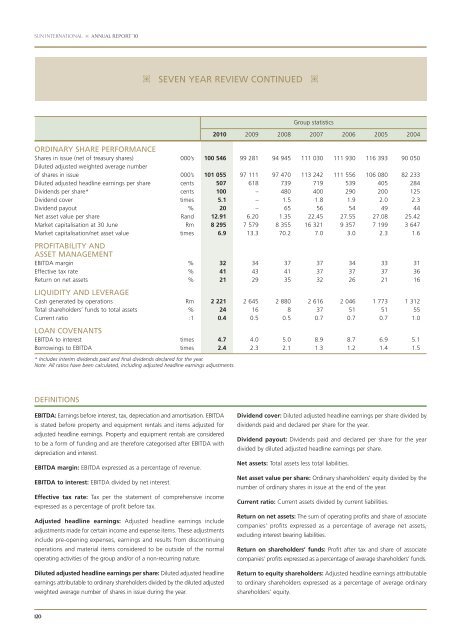
SEVEN YEAR REVIEW CONTINUED<br />
Group statistics<br />
2010 2009 2008 2007 2006 2005 2004<br />
ORDINARY SHARE PERFORMANCE<br />
Shares in issue (net of treasury shares) 000’s 100 546 99 281 94 945 111 030 111 930 116 393 90 050<br />
Diluted adjusted weighted average number<br />
of shares in issue 000’s 101 055 97 111 97 470 113 242 111 556 106 080 82 233<br />
Diluted adjusted headline earnings per share cents 507 618 739 719 539 405 284<br />
Dividends per share* cents 100 – 480 400 290 200 1<strong>25</strong><br />
Dividend cover times 5.1 – 1.5 1.8 1.9 2.0 2.3<br />
Dividend payout % 20 – 65 56 54 49 44<br />
Net asset value per share Rand 12.91 6.20 1.35 22.45 27.55 27.08 <strong>25</strong>.42<br />
Market capitalisation at 30 June Rm 8 295 7 579 8 355 16 321 9 357 7 199 3 647<br />
Market capitalisation/net asset value times 6.9 13.3 70.2 7.0 3.0 2.3 1.6<br />
PROFITABILITY AND<br />
ASSET MANAGEMENT<br />
EBITDA margin % 32 34 37 37 34 33 31<br />
Effective tax rate % 41 43 41 37 37 37 36<br />
Return on net assets % 21 29 35 32 26 21 16<br />
LIQUIDITY AND LEVERAGE<br />
Cash generated by operations Rm 2 221 2 645 2 880 2 616 2 046 1 773 1 312<br />
Total shareholders’ funds to total assets % 24 16 8 37 51 51 55<br />
Current ratio :1 0.4 0.5 0.5 0.7 0.7 0.7 1.0<br />
LOAN COVENANTS<br />
EBITDA to interest times 4.7 4.0 5.0 8.9 8.7 6.9 5.1<br />
Borrowings to EBITDA times 2.4 2.3 2.1 1.3 1.2 1.4 1.5<br />
* Includes interim dividends paid and final dividends declared for the year.<br />
Note: All ratios have been calculated, including adjusted headline earnings adjustments.<br />
DEFINITIONS<br />
EBITDA: Earnings before interest, tax, depreciation and amortisation. EBITDA<br />
is stated before property and equipment rentals and items adjusted for<br />
adjusted headline earnings. Property and equipment rentals are considered<br />
to be a form of funding and are therefore categorised after EBITDA with<br />
depreciation and interest.<br />
EBITDA margin: EBITDA expressed as a percentage of revenue.<br />
EBITDA to interest: EBITDA divided by net interest.<br />
Effective tax rate: Tax per the statement of comprehensive income<br />
expressed as a percentage of profit before tax.<br />
Adjusted headline earnings: Adjusted headline earnings include<br />
adjustments made for certain income and expense items. These adjustments<br />
include pre-opening expenses, earnings and results from discontinuing<br />
operations and material items considered to be outside of the normal<br />
operating activities of the group and/or of a non-recurring nature.<br />
Diluted adjusted headline earnings per share: Diluted adjusted headline<br />
earnings attributable to ordinary share holders divided by the diluted adjusted<br />
weighted average number of shares in issue during the year.<br />
Dividend cover: Diluted adjusted headline earnings per share divided by<br />
dividends paid and declared per share for the year.<br />
Dividend payout: Dividends paid and declared per share for the year<br />
divided by diluted adjusted headline earnings per share.<br />
Net assets: Total assets less total liabilities.<br />
Net asset value per share: Ordinary shareholders’ equity divided by the<br />
number of ordinary shares in issue at the end of the year.<br />
Current ratio: Current assets divided by current liabilities.<br />
Return on net assets: The sum of operating profits and share of associate<br />
companies’ profits expressed as a percentage of average net assets,<br />
excluding interest bearing liabilities.<br />
Return on shareholders’ funds: Profit after tax and share of associate<br />
companies’ profits expressed as a percentage of average shareholders’ funds.<br />
Return to equity shareholders: Adjusted headline earnings attributable<br />
to ordinary shareholders expressed as a percentage of average ordinary<br />
shareholders’ equity.