PDF 25 MB - Sun International | Investor Centre
PDF 25 MB - Sun International | Investor Centre
PDF 25 MB - Sun International | Investor Centre

Create successful ePaper yourself
Turn your PDF publications into a flip-book with our unique Google optimized e-Paper software.
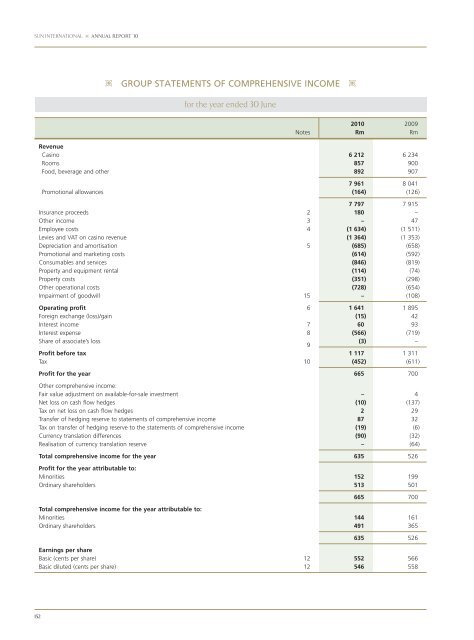
SUN INTERNATIONAL ANNUAL REPORT ’10<br />
152<br />
GROUP STATEMENTS OF COMPREHENSIVE INCOME<br />
for the year ended 30 June<br />
Revenue<br />
Casino 6 212 6 234<br />
Rooms 857 900<br />
Food, beverage and other 892 907<br />
7 961 8 041<br />
Promotional allowances (164) (126)<br />
7 797 7 915<br />
Insurance proceeds 2 180 –<br />
Other income 3 – 47<br />
Employee costs 4 (1 634) (1 511)<br />
Levies and VAT on casino revenue (1 364) (1 353)<br />
Depreciation and amortisation 5 (685) (658)<br />
Promotional and marketing costs (614) (592)<br />
Consumables and services (846) (819)<br />
Property and equipment rental (114) (74)<br />
Property costs (351) (298)<br />
Other operational costs (728) (654)<br />
Impairment of goodwill 15 – (108)<br />
Operating profit 6 1 641 1 895<br />
Foreign exchange (loss)/gain (15) 42<br />
Interest income 7 60 93<br />
Interest expense 8 (566) (719)<br />
Share of associate’s loss<br />
9<br />
(3) –<br />
Profit before tax 1 117 1 311<br />
Tax 10 (452) (611)<br />
Profit for the year 665 700<br />
Other comprehensive income:<br />
Fair value adjustment on available-for-sale investment – 4<br />
Net loss on cash flow hedges (10) (137)<br />
Tax on net loss on cash flow hedges 2 29<br />
Transfer of hedging reserve to statements of comprehensive income 87 32<br />
Tax on transfer of hedging reserve to the statements of comprehensive income (19) (6)<br />
Currency translation differences (90) (32)<br />
Realisation of currency translation reserve – (64)<br />
Total comprehensive income for the year 635 526<br />
Profit for the year attributable to:<br />
Minorities 152 199<br />
Ordinary shareholders 513 501<br />
Notes<br />
2010<br />
Rm<br />
2009<br />
Rm<br />
665 700<br />
Total comprehensive income for the year attributable to:<br />
Minorities 144 161<br />
Ordinary shareholders 491 365<br />
635 526<br />
Earnings per share<br />
Basic (cents per share) 12 552 566<br />
Basic diluted (cents per share) 12 546 558