PDF 25 MB - Sun International | Investor Centre
PDF 25 MB - Sun International | Investor Centre
PDF 25 MB - Sun International | Investor Centre

Create successful ePaper yourself
Turn your PDF publications into a flip-book with our unique Google optimized e-Paper software.
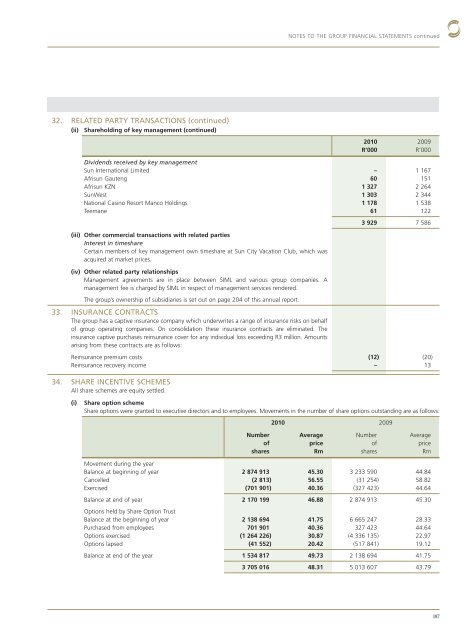
32. RELATED PARTY TRANSACTIONS (continued)<br />
(ii) Shareholding of key management (continued)<br />
NOTES TO THE GROUP FINANCIAL STATEMENTS continued<br />
2010<br />
R’000<br />
2009<br />
R’000<br />
Dividends received by key management<br />
<strong>Sun</strong> <strong>International</strong> Limited – 1 167<br />
Afrisun Gauteng 60 151<br />
Afrisun KZN 1 327 2 264<br />
<strong>Sun</strong>West 1 303 2 344<br />
National Casino Resort Manco Holdings 1 178 1 538<br />
Teemane 61 122<br />
(iii) Other commercial transactions with related parties<br />
Interest in timeshare<br />
Certain members of key management own timeshare at <strong>Sun</strong> City Vacation Club, which was<br />
acquired at market prices.<br />
(iv) Other related party relationships<br />
Management agreements are in place between SIML and various group companies. A<br />
manage ment fee is charged by SIML in respect of management services rendered.<br />
The group’s ownership of subsidiaries is set out on page 204 of this annual report.<br />
33. INSURANCE CONTRACTS<br />
The group has a captive insurance company which underwrites a range of insurance risks on behalf<br />
of group operating companies. On consolidation these insurance contracts are eliminated. The<br />
insurance captive purchases reinsurance cover for any individual loss exceeding R3 million. Amounts<br />
arising from these contracts are as follows:<br />
3 929 7 586<br />
Reinsurance premium costs (12) (20)<br />
Reinsurance recovery income – 13<br />
34. SHARE INCENTIVE SCHEMES<br />
All share schemes are equity settled.<br />
(i) Share option scheme<br />
Share options were granted to executive directors and to employees. Movements in the number of share options outstanding are as follows:<br />
2010 2009<br />
Number<br />
of<br />
shares<br />
Average<br />
price<br />
Rm<br />
Number<br />
of<br />
shares<br />
Average<br />
price<br />
Rm<br />
Movement during the year<br />
Balance at beginning of year 2 874 913 45.30 3 233 590 44.84<br />
Cancelled (2 813) 56.55 (31 <strong>25</strong>4) 58.82<br />
Exercised (701 901) 40.36 (327 423) 44.64<br />
Balance at end of year 2 170 199 46.88 2 874 913 45.30<br />
Options held by Share Option Trust<br />
Balance at the beginning of year 2 138 694 41.75 6 665 247 28.33<br />
Purchased from employees 701 901 40.36 327 423 44.64<br />
Options exercised (1 264 226) 30.87 (4 336 135) 22.97<br />
Options lapsed (41 552) 20.42 (517 841) 19.12<br />
Balance at end of the year 1 534 817 49.73 2 138 694 41.75<br />
3 705 016 48.31 5 013 607 43.79<br />
187