PDF 25 MB - Sun International | Investor Centre
PDF 25 MB - Sun International | Investor Centre
PDF 25 MB - Sun International | Investor Centre

Create successful ePaper yourself
Turn your PDF publications into a flip-book with our unique Google optimized e-Paper software.
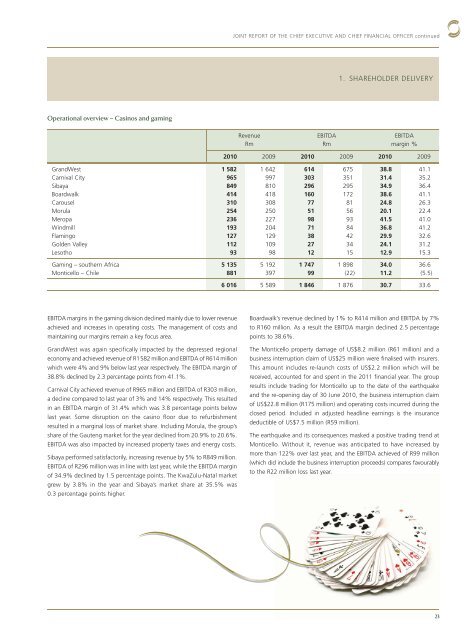
Operational overview – Casinos and gaming<br />
EBITDA margins in the gaming division declined mainly due to lower revenue<br />
achieved and increases in operating costs. The management of costs and<br />
maintaining our margins remain a key focus area.<br />
GrandWest was again specifically impacted by the depressed regional<br />
economy and achieved revenue of R1 582 million and EBITDA of R614 million<br />
which were 4% and 9% below last year respectively. The EBITDA margin of<br />
38.8% declined by 2.3 percentage points from 41.1%.<br />
Carnival City achieved revenue of R965 million and EBITDA of R303 million,<br />
a decline compared to last year of 3% and 14% respectively. This resulted<br />
in an EBITDA margin of 31.4% which was 3.8 percentage points below<br />
last year. Some disruption on the casino floor due to refurbishment<br />
resulted in a marginal loss of market share. Including Morula, the group’s<br />
share of the Gauteng market for the year declined from 20.9% to 20.6%.<br />
EBITDA was also impacted by increased property taxes and energy costs.<br />
Sibaya performed satisfactorily, increasing revenue by 5% to R849 million.<br />
EBITDA of R296 million was in line with last year, while the EBITDA margin<br />
of 34.9% declined by 1.5 percentage points. The KwaZulu-Natal market<br />
grew by 3.8% in the year and Sibaya’s market share at 35.5% was<br />
0.3 percentage points higher.<br />
JOINT REPORT OF THE CHIEF EXECUTIVE AND CHIEF FINANCIAL OFFICER continued<br />
Revenue<br />
Rm<br />
EBITDA<br />
Rm<br />
1. SHAREHOLDER DELIVERY<br />
EBITDA<br />
margin %<br />
2010 2009 2010 2009 2010 2009<br />
GrandWest 1 582 1 642 614 675 38.8 41.1<br />
Carnival City 965 997 303 351 31.4 35.2<br />
Sibaya 849 810 296 295 34.9 36.4<br />
Boardwalk 414 418 160 172 38.6 41.1<br />
Carousel 310 308 77 81 24.8 26.3<br />
Morula <strong>25</strong>4 <strong>25</strong>0 51 56 20.1 22.4<br />
Meropa 236 227 98 93 41.5 41.0<br />
Windmill 193 204 71 84 36.8 41.2<br />
Flamingo 127 129 38 42 29.9 32.6<br />
Golden Valley 112 109 27 34 24.1 31.2<br />
Lesotho 93 98 12 15 12.9 15.3<br />
Gaming – southern Africa 5 135 5 192 1 747 1 898 34.0 36.6<br />
Monticello – Chile 881 397 99 (22) 11.2 (5.5)<br />
6 016 5 589 1 846 1 876 30.7 33.6<br />
Boardwalk’s revenue declined by 1% to R414 million and EBITDA by 7%<br />
to R160 million. As a result the EBITDA margin declined 2.5 percentage<br />
points to 38.6%.<br />
The Monticello property damage of US$8.2 million (R61 million) and a<br />
business interruption claim of US$<strong>25</strong> million were finalised with insurers.<br />
This amount includes re-launch costs of US$2.2 million which will be<br />
received, accounted for and spent in the 2011 financial year. The group<br />
results include trading for Monticello up to the date of the earthquake<br />
and the re-opening day of 30 June 2010, the business interruption claim<br />
of US$22.8 million (R175 million) and operating costs incurred during the<br />
closed period. Included in adjusted headline earnings is the insurance<br />
deductible of US$7.5 million (R59 million).<br />
The earthquake and its consequences masked a positive trading trend at<br />
Monticello. Without it, revenue was anticipated to have increased by<br />
more than 122% over last year, and the EBITDA achieved of R99 million<br />
(which did include the business interruption proceeds) compares favourably<br />
to the R22 million loss last year.<br />
23