Datascope Passport - Mindray
Datascope Passport - Mindray
Datascope Passport - Mindray

Create successful ePaper yourself
Turn your PDF publications into a flip-book with our unique Google optimized e-Paper software.
Graph Trends (<strong>Passport</strong> 2 Only) Operation<br />
3.14 Graph Trends (<strong>Passport</strong> 2 Only)<br />
Normal Screen<br />
Scroll<br />
Scroll<br />
Event<br />
Zoom<br />
Rescale Waves<br />
Clear Trends<br />
List Trends<br />
Setup<br />
Events<br />
11:40<br />
300<br />
0<br />
100<br />
0<br />
100<br />
80<br />
50<br />
Select to return to the Normal Screen<br />
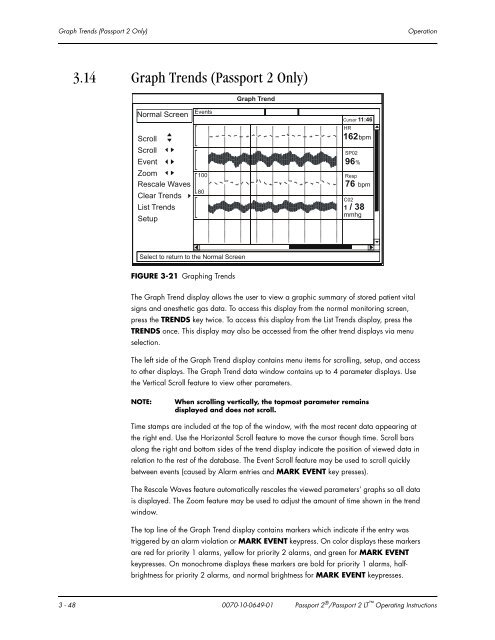
FIGURE 3-21 Graphing Trends<br />
0<br />
Graph Trend<br />
11:45<br />
12:00 Cursor 11:46<br />
HR<br />
162bpm<br />
The Graph Trend display allows the user to view a graphic summary of stored patient vital<br />
signs and anesthetic gas data. To access this display from the normal monitoring screen,<br />
press the TRENDS key twice. To access this display from the List Trends display, press the<br />
TRENDS once. This display may also be accessed from the other trend displays via menu<br />
selection.<br />
The left side of the Graph Trend display contains menu items for scrolling, setup, and access<br />
to other displays. The Graph Trend data window contains up to 4 parameter displays. Use<br />
the Vertical Scroll feature to view other parameters.<br />
NOTE: When scrolling vertically, the topmost parameter remains<br />
displayed and does not scroll.<br />
Time stamps are included at the top of the window, with the most recent data appearing at<br />
the right end. Use the Horizontal Scroll feature to move the cursor though time. Scroll bars<br />
along the right and bottom sides of the trend display indicate the position of viewed data in<br />
relation to the rest of the database. The Event Scroll feature may be used to scroll quickly<br />
between events (caused by Alarm entries and MARK EVENT key presses).<br />
The Rescale Waves feature automatically rescales the viewed parameters’ graphs so all data<br />
is displayed. The Zoom feature may be used to adjust the amount of time shown in the trend<br />
window.<br />
The top line of the Graph Trend display contains markers which indicate if the entry was<br />
triggered by an alarm violation or MARK EVENT keypress. On color displays these markers<br />
are red for priority 1 alarms, yellow for priority 2 alarms, and green for MARK EVENT<br />
keypresses. On monochrome displays these markers are bold for priority 1 alarms, halfbrightness<br />
for priority 2 alarms, and normal brightness for MARK EVENT keypresses.<br />
3 - 48 0070-10-0649-01 <strong>Passport</strong> 2 ® /<strong>Passport</strong> 2 LT Operating Instructions<br />
11:50<br />
11:55<br />
SP02<br />
96%<br />
Resp<br />
76 bpm<br />
C02<br />
1 / 38<br />
mmhg