Documento en formato pdf (3694 kb) - Cepal
Documento en formato pdf (3694 kb) - Cepal
Documento en formato pdf (3694 kb) - Cepal

Create successful ePaper yourself
Turn your PDF publications into a flip-book with our unique Google optimized e-Paper software.
26 Tres décadas de cambio y continuidad <strong>en</strong> la nupcialidad latinoamericana<br />
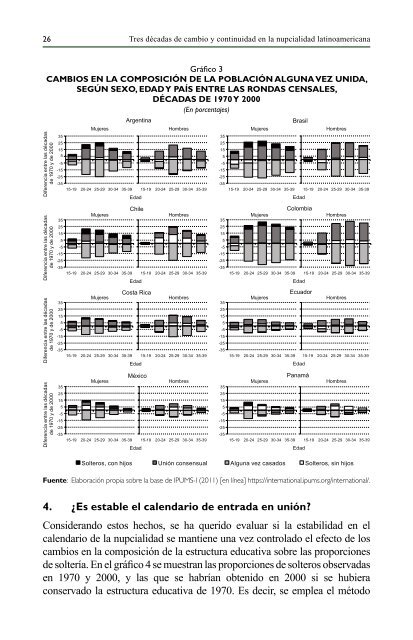
Gráfico 3<br />
CAMBIOS EN LA COMPOSICIÓN DE LA POBLACIÓN ALGUNA VEZ UNIDA,<br />
SEGÚN SEXO, EDAD Y PAÍS ENTRE LAS RONDAS CENSALES,<br />
DÉCADAS DE 1970 Y 2000<br />
(En porc<strong>en</strong>tajes)<br />
Difer<strong>en</strong>cia <strong>en</strong>tre las décadas<br />
de 1970 y de 2000<br />
Difer<strong>en</strong>cia <strong>en</strong>tre las décadas<br />
de 1970 y de 2000<br />
Difer<strong>en</strong>cia <strong>en</strong>tre las décadas<br />
de 1970 y de 2000<br />
Difer<strong>en</strong>cia <strong>en</strong>tre las décadas<br />
de 1970 y de 2000<br />
35<br />
25<br />
15<br />
5<br />
-5<br />
-15<br />
-25<br />
-35<br />
35<br />
25<br />
15<br />
5<br />
-5<br />
-15<br />
-25<br />
-35<br />
35<br />
25<br />
15<br />
5<br />
-5<br />
-15<br />
-25<br />
-35<br />
35<br />
25<br />
15<br />
5<br />
-5<br />
-15<br />
-25<br />
-35<br />
Arg<strong>en</strong>tina<br />
15-19 20-24 25-29 30-34 35-39 15-19 20-24 25-29 30-34 35-39 15-19 20-24 25-29 30-34 35-39 15-19 20-24 25-29 30-34 35-39<br />
Edad<br />
Brasil<br />
Mujeres Hombres Mujeres Hombres<br />
Chile<br />
Colombia<br />
Mujeres Hombres Mujeres Hombres<br />
35<br />
15-19 20-24 25-29 30-34 35-39 15-19 20-24 25-29 30-34 35-39<br />
Edad<br />
Costa Rica<br />
Ecuador<br />
Mujeres Hombres Mujeres Hombres<br />
35<br />
15-19 20-24 25-29 30-34 35-39 15-19 20-24 25-29 30-34 35-39<br />
Edad<br />
México<br />
Panamá<br />
Mujeres Hombres Mujeres Hombres<br />
35<br />
15-19 20-24 25-29 30-34 35-39 15-19 20-24 25-29 30-34 35-39<br />
Edad<br />
35<br />
25<br />
15<br />
5<br />
-5<br />
-15<br />
-25<br />
-35<br />
25<br />
15<br />
5<br />
-5<br />
-15<br />
-25<br />
-35<br />
25<br />
15<br />
5<br />
-5<br />
-15<br />
-25<br />
-35<br />
25<br />
15<br />
5<br />
-5<br />
-15<br />
-25<br />
-35<br />
Edad<br />
15-19 20-24 25-29 30-34 35-39 15-19 20-24 25-29 30-34 35-39<br />
Edad<br />
15-19 20-24 25-29 30-34 35-39 15-19 20-24 25-29 30-34 35-39<br />
Edad<br />
15-19 20-24 25-29 30-34 35-39 15-19 20-24 25-29 30-34 35-39<br />
Solteros, con hijos Unión cons<strong>en</strong>sual Alguna vez casados Solteros, sin hijos<br />
Fu<strong>en</strong>te: Elaboración propia sobre la base de IPUMS-I (2011) [<strong>en</strong> línea] https://international.ipums.org/international/.<br />
Edad<br />
4. ¿Es estable el cal<strong>en</strong>dario de <strong>en</strong>trada <strong>en</strong> unión?<br />
Considerando estos hechos, se ha querido evaluar si la estabilidad <strong>en</strong> el<br />
cal<strong>en</strong>dario de la nupcialidad se manti<strong>en</strong>e una vez controlado el efecto de los<br />
cambios <strong>en</strong> la composición de la estructura educativa sobre las proporciones<br />
de soltería. En el gráfico 4 se muestran las proporciones de solteros observadas<br />
<strong>en</strong> 1970 y 2000, y las que se habrían obt<strong>en</strong>ido <strong>en</strong> 2000 si se hubiera<br />
conservado la estructura educativa de 1970. Es decir, se emplea el método