TESIS COMPLETA.pdf - El Instituto Español de OceanografÃa
TESIS COMPLETA.pdf - El Instituto Español de OceanografÃa
TESIS COMPLETA.pdf - El Instituto Español de OceanografÃa

Create successful ePaper yourself
Turn your PDF publications into a flip-book with our unique Google optimized e-Paper software.
Capítulo 5<br />
RT: 0.00 - 60.00<br />
2.35<br />
100<br />
95<br />
90<br />
LAS<br />
SU5<br />
NL:<br />
1.77E7<br />
Base Peak<br />
MS esu<br />
4_1 16<br />
85<br />
37.09<br />
Abundancia Relative Abundance<br />
relativa<br />
80<br />
75<br />
70<br />
65<br />
60<br />
55<br />
50<br />
45<br />
40<br />
SPC<br />
39.45<br />
a<br />
35<br />
41.99<br />
30<br />
27.25<br />
25<br />
20<br />
34.89<br />
15<br />
25.47<br />
10<br />
15.95<br />
14.53 32.93<br />
17.77 42.86<br />
11.62<br />
5<br />
3.74 30.59<br />
45.05 53.16<br />
9.91 55.70<br />
0<br />
0 5 10 15 20 25 30 35 40 45 50 55<br />
Tim e (m in)<br />
Tiempo (min)<br />
esu 4_1 16 #3314 RT: 25.40 AV: 1 NL: 1.38E6<br />
T: - c ESI Full ms [ 150.00-600.00]<br />
100<br />
95<br />
90<br />
85<br />
355.3<br />
T.R.: 25.40 min<br />
m/z 355 (C 12 SPC)<br />
esu 4_1 16 #3552 RT: 27.26 AV: 1 NL: 3.87E6<br />
T: - c ESI Full m s [ 150.00-600.00]<br />
100<br />
95<br />
90<br />
85<br />
369.2<br />
T.R.: 27.26 min<br />
m/z 369 (C 13 SPC)<br />
Abundancia relativa<br />
Relative Abundance<br />
80<br />
75<br />
70<br />
65<br />
60<br />
55<br />
50<br />
45<br />
40<br />
35<br />
b<br />
Abundancia relativa<br />
Relative Abundance<br />
80<br />
75<br />
70<br />
65<br />
60<br />
55<br />
50<br />
45<br />
40<br />
35<br />
c<br />
30<br />
30<br />
25<br />
25<br />
20<br />
356.3 452.9<br />
15<br />
357.3 385.0<br />
10<br />
313.2 419.3<br />
325.2<br />
275.0 541.2<br />
474.9<br />
527.7 586.9<br />
195.0 377.3<br />
5<br />
248.0<br />
159.0 208.8<br />
0<br />
150 200 250 300 350 400 450 500 550 600<br />
m/z<br />
m/z<br />
150 200 250 300 350 400 450 500 550 600<br />
m/z<br />
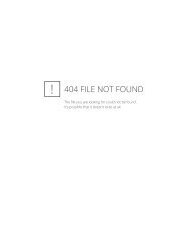
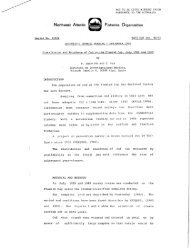
Figura 5.6. Cromatograma obtenido por cromatografía líquida con espectrometría<br />
<strong>de</strong> masas (a) para una muestra <strong>de</strong> agua <strong>de</strong> la ría <strong>de</strong> Suances (SU4). También se<br />
muestran los espectros <strong>de</strong> m/z correspondientes a los homólogos C12SPC, m/z<br />
355 (b) y C13SPC, m/z 369(c), <strong>de</strong>tectados en esta estación.<br />
20<br />
15<br />
10<br />
5<br />
0<br />
370.3<br />
463.1<br />
371.2<br />
468.0<br />
390.9 522.6 584.6<br />
181.0 238.8 265.0<br />
292.9 330.5<br />
421.2<br />
573.8<br />
216.9<br />
m/z<br />
466.8<br />
Las concentraciones <strong>de</strong> LAS y SPC <strong>de</strong>tectadas en sedimentos (Tabla 5.8),<br />
mayores que las <strong>de</strong> la columna <strong>de</strong> agua, confirman su afinidad por la fase sólida. En las<br />
muestras analizadas -próximas a los núcleos urbanos- las concentraciones totales <strong>de</strong><br />
LAS más comunes oscilan entre 0.2 y 5 µg·g -1 , mientras que para el SPC oscilan entre 20<br />
y 200µg·Kg -1 . La concentración máxima <strong>de</strong> LAS en sedimento superficial (26 µg·g -1 ) se<br />
<strong>de</strong>tectó en el caño <strong>de</strong> Sancti Petri, junto al vertido <strong>de</strong> aguas residuales sin <strong>de</strong>purar<br />
proce<strong>de</strong>nte <strong>de</strong> la ciudad <strong>de</strong> San Fernando (estación B). En el sedimento (Fig. 5.7) se han<br />
<strong>de</strong>tectado todos los homólogos <strong>de</strong>l LAS (C 10 -C 14 ), predominando en todas las zonas, al<br />
contrario que para las muestras <strong>de</strong> agua, los <strong>de</strong> mayor peso molecular (C 12 LAS y<br />
C 13 LAS). Como resultados significativos podríamos <strong>de</strong>stacar la presencia <strong>de</strong> C 14 LAS que<br />
constituye más <strong>de</strong>l 1% <strong>de</strong>l total en todas las muestras, alcanzando en la ría <strong>de</strong> Santoña<br />
(zona con mayor contenido <strong>de</strong> carbono orgánico), el 6% (mirar figura) así como la no<br />
194