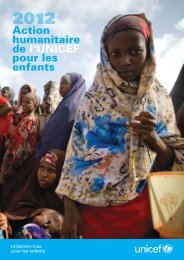
La situation des enfants dans le monde 2008 - Unicef
La situation des enfants dans le monde 2008 - Unicef
La situation des enfants dans le monde 2008 - Unicef
You also want an ePaper? Increase the reach of your titles
YUMPU automatically turns print PDFs into web optimized ePapers that Google loves.
TABLEAU 3 : SANTÉPays et territoires% de la populationutilisant <strong>des</strong>sources d’eaupotab<strong>le</strong>améliorées2004tota<strong>le</strong> urbaine rura<strong>le</strong>% de la populationayant accès à <strong>des</strong>installationsd’assainissementadéquates2004tota<strong>le</strong> urbaine rura<strong>le</strong>% devaccinsPEVréguliersfinancéspar l’Etat2006tota<strong>le</strong>Vaccination 2006Enfants d’un an vaccinés contre :TB DTC polio rougeo<strong>le</strong> HepB HibVaccins correspondantsBCG DTC1 β DTC3 β polio3 rougeo<strong>le</strong> HepB3 Hib3Afghanistan 39 63 31 34 49 29 0 90 90 77 77 68 - - 88 28 - 48 - - -Afrique du Sud 88 99 73 65 79 46 100 97 99 99 99 85 99 99 88 75x -x 37x - - -Albanie 96 99 94 91 99 84 - 98 98 98 97 97 98 - 87 45 38 50 - - -Algérie 85 88 80 92 99 82 100 99 98 95 95 91 80 - 70 53 59 24 - - -Al<strong>le</strong>magne 100 100 100 100 100 100 - - 96 90 96 94 86 94 - - - - - - -Andorre 100 100 100 100 100 100 - - 97 93 93 91 84 93 - - - - - - -Angola 53 75 40 31 56 16 67 65 66 44 44 48 - - 80 58 - 32 - - -Antigua-et-Barbuda 91 95 89 95 98 94 100 - 96 99 99 99 99 99 - - - - - - -Arabie saoudite - 97 - - 100 - 100 95 97 96 96 95 96 96 56 - - - - - -Argentine 96 98 80 91 92 83 - 99 93 91 92 97 84 91 - - - - - - -Arménie 92 99 80 83 96 61 30 91 95 87 87 92 78 - - 36 11 59 - - -Australie 100 100 100 100 100 100 - - 97 92 92 94 94 94 - - - - - - -Autriche 100 100 100 100 100 100 88 - 94 83 83 80 83 83 - - - - - - -Azerbaïdjan 77 95 59 54 73 36 70 99 97 95 97 96 93 - - 36 - 40 12x 1x 1xBahamas 97 98 86 100 100 100 100 - 95 95 94 88 96 95 65 - - - - - -Bahreïn - 100 - - 100 - 100 - 99 98 98 99 98 97 92 - - - - - -Bangla<strong>des</strong>h 74 82 72 39 51 35 63 96 96 88 88 81 88 - 92 30 22 49 - - -Barbade 100 100 100 100 99 100 100 - 81 84 85 92 84 84 - - - - - - -Bélarus 100 100 100 84 93 61 100 99 99 99 97 97 98 - - 90 67 54 - - -Belgique - 100 - - - - - - 98 97 97 88 78 95 94 - - - - - -Belize 91 100 82 47 71 25 100 97 96 98 98 99 98 98 80 66x -x - - - -Bénin 67 78 57 33 59 11 10 99 99 93 93 89 93 93 84 35 - 42 47 20 54Bhoutan 62 86 60 70 65 70 - 92 98 95 96 90 95 - 88 - - - - - -Bolivie 85 95 68 46 60 22 69 93 94 81 79 81 81 81 - 52 - 54 - - -Bosnie-Herzégovine 97 99 96 95 99 92 85 97 94 87 91 90 82 85 85 91 73 53 - - -Botswana 95 100 90 42 57 25 100 99 98 97 97 90 85 - 71 14 - 7 - - -Brésil 90 96 57 75 83 37 - 99 99 99 99 99 97 99 84 46x 15x 28x - - -Brunéi Darussalam - - - - - - - 96 99 99 99 97 99 99 92 - - - - - -Bulgarie 99 100 97 99 100 96 100 98 97 95 96 96 96 - 65 - - - - - -Burkina Faso 61 94 54 13 42 6 17 99 99 95 94 88 76 76 - 39 15 42 18 10 48Burundi 79 92 77 36 47 35 1 84 86 74 64 75 74 74 84 38 26 23 13 8 30Cambodge 41 64 35 17 53 8 0 87 85 80 80 78 80 - 80 48 - 59 88 4 0Cameroun 66 86 44 51 58 43 20 85 87 81 78 73 81 - 52 35 38 22 27 13 58Canada 100 100 99 100 100 99 - - 97 94 94 94 14 94 82 - - - - - -Cap-Vert 80 86 73 43 61 19 90 70 74 72 72 65 69 - - - - - - - -Chili 95 100 58 91 95 62 100 98 95 94 94 91 94 94 - - - - - - -Chine 77 93 67 44 69 28 - 92 94 93 94 93 91 - - - - - - - -Chypre 100 100 100 100 100 100 36 - 99 97 97 87 93 90 - - - - - - -Colombie 93 99 71 86 96 54 100 88 95 86 86 88 86 86 88 62 - 39 24x - -Comores 86 92 82 33 41 29 0 84 78 69 69 66 69 - 77 49 - 31 36x 9x 63xCongo 58 84 27 27 28 25 75 84 81 79 79 66 - - 84 48 - 39 68 6 48Congo, Républiquedémocratique du 46 82 29 30 42 25 0 87 87 77 78 73 - - 77 36 - 17 12x 1x 52xCorée, République de 92 97 71 - - - - 98 98 98 98 99 99 - - - - - - - -Corée, République populairedémocratique de 100 100 100 59 58 60 - 96 91 89 98 96 96 - - 93 - - - - -Costa Rica 97 100 92 92 89 97 - 88 89 91 91 89 90 89 - - - - - - -Côte d’Ivoire 84 97 74 37 46 29 28 77 95 77 76 73 77 - - 35 19 45 17 6 36Croatie 100 100 100 100 100 100 100 98 96 96 96 96 - 96 - - - - - - -Cuba 91 95 78 98 99 95 99 99 96 89 99 96 89 97 - - - - - - -Danemark 100 100 100 - - - 100 - 93 93 93 99 - 93 - - - - - - -Djibouti 73 76 59 82 88 50 - 88 76 72 72 67 - - 77 62 43 33 9 1 10Dominique 97 100 90 84 86 75 100 99 99 95 88 99 7 7 - - - - - - -Egypte 98 99 97 70 86 58 100 99 98 98 98 98 98 - 86 63 - 27 - - -El Salvador 84 94 70 62 77 39 100 93 98 96 96 98 96 96 91 62 - - - - -Emirats arabes unis 100 100 100 98 98 95 - 98 97 94 94 92 92 94 - - - - - - -Equateur 94 97 89 89 94 82 100 99 99 98 97 97 98 98 66 - - - - - -Erythrée 60 74 57 9 32 3 10 99 99 97 96 95 97 - 79 44 - 54 12x 4x 4xEspagne 100 100 100 100 100 100 100 - 98 98 98 97 81 98 72 - - - - - -Estonie 100 100 99 97 97 96 100 99 98 95 95 96 95 88 - - - - - - -Etats-Unis 100 100 100 100 100 100 - - 99 96 92 93 92 94 - - - - - - -Ethiopie 22 81 11 13 44 7 0 72 80 72 69 63 - - 80 19 - 15 2 2 3Ex-Républiqueyougoslave de Macédoine - - - - - - - 92 95 93 92 94 89 - 88 93 74 45 - - -Fidji 47 43 51 72 87 55 100 93 84 81 83 99 81 81 93 - - - - - -Finlande 100 100 100 100 100 100 100 98 99 97 97 97 - 98 - - - - - - -% denouveaunésprotégéscontre <strong>le</strong>tétanos λ% de moins de5 ans présumésatteints d’unepneumonie etayant consultéun agent <strong>des</strong>anté qualifié ±2000-2006*% d’<strong>enfants</strong>de moins de 5ans présumésatteints d’unepneumonie etrecevant <strong>des</strong>antibiotiques ±% de moinsde 5 anssouffrantde diarrhéeet bénéficiantd’uneréhydratationora<strong>le</strong>et d’une alimentationen continu2000-2006*% demoins de5 ans quidormentsous unemoustiquairePaludisme 2003-2006*% demoins de5 ans quidormentsous unemoustiquaireimprégnéed’insecticide% demoins de5 ansatteintsde fièvreet recevant<strong>des</strong> médicamentsantipaludiques122 LA SITUATION DES ENFANTS DANS LE MONDE <strong>2008</strong>


