Anexo C – Consumo industrial de fibras e filamentos <strong>no</strong> <strong>Brasil</strong> – 1980 a 2004 Naturais Artificiais Sintéticas Lã Linho/ Se<strong>da</strong> ViscoPoliaPoliésAcríPolipro- Total A<strong>no</strong> Algodão lava<strong>da</strong> Rami (fio) Juta Total se Acetato Total mi<strong>da</strong>terlicopile<strong>no</strong> Total geral 1980 572,4 18,4 18,3 0,44 109,7 719,2 44,2 4,6 48,8 90,8 121,1 28,5 (1) 240,4 1.008,4 1981 561,9 16,3 14,1 0,36 94,0 686,7 39,1 3,0 42,1 70,0 89,7 23,4 (1) 183,1 911,9 1982 580,6 17,5 9,1 0,49 85,9 693,6 39,1 2,3 41,4 69,9 100,2 23,1 (1) 193,2 928,2 1983 556,7 13,2 10,0 0,30 62,9 643,1 30,0 1,7 31,7 61,1 89,4 18,9 (1) 169,4 844,2 1984 555,2 14,7 13,3 0,24 78,6 662,0 34,3 1,9 36,2 55,9 90,3 17,5 (1) 163,7 861,9 1985 631,4 14,2 13,6 0,35 88,5 748,1 35,5 2,3 37,8 62,0 107,2 23,5 (1) 192,7 978,6 1986 736,5 13,4 13,2 0,51 88,7 852,3 40,1 2,4 42,5 85,5 126,1 26,5 (1) 238,1 1.132,9 1987 774,7 14,7 19,3 0,53 98,9 908,1 41,0 1,9 42,9 81,0 136,6 27,8 74,3 319,7 1.270,7 1988 838,0 14,2 21,4 0,49 69,0 943,1 39,2 2,9 42,1 70,8 119,2 27,2 78,0 295,2 1.280,4 1989 810,0 17,9 12,5 0,48 43,0 883,9 45,4 2,3 47,7 73,6 132,5 30,2 70,7 307,0 1.238,6 1990 730,0 18,0 16,4 0,33 29,7 794,4 38,4 3,4 41,8 65,6 112,6 20,4 73,0 271,6 1.107,8 1991 718,1 17,4 18,4 0,30 25,3 779,5 41,6 3,6 45,2 69,6 128,5 29,3 87,6 315,0 1.139,7 1992 741,6 13,2 18,4 0,19 30,1 803,5 38,3 2,8 41,1 60,3 135,4 19,9 77,4 293,0 1.137,6 1993 829,5 13,0 19,1 0,25 29,5 891,4 49,5 4,5 54,0 75,6 160,8 25,1 86,3 347,8 1.293,2 1994 836,6 12,5 12,4 0,15 26,9 888,6 51,7 5,3 57,0 78,3 179,4 27,4 104,5 389,6 1.335,2 1995 803,7 8,2 12,1 0,13 19,9 844,0 44,7 7,2 51,9 99,1 186,5 26,5 111,9 424,0 1.319,9 1996 829,1 7,8 10,6 0,11 14,6 862,2 27,2 7,6 34,8 107,3 186,6 26,9 107,1 427,9 1.324,9 1997 798,7 9,8 9,2 0,06 23,0 840,8 30,5 2,9 33,4 101,1 229,6 31,6 109,0 471,3 1.345,5 1998 782,9 4,1 4,4 0,06 15,6 807,1 27,0 2,4 29,4 94,5 224,1 29,4 110,0 458,0 1.294,5 1999 806,5 2,3 5,7 0,07 13,0 827,6 30,8 1,9 32,7 100,5 277,5 38,6 114,3 530,9 1.391,2 2000 885,0 8,3 2,4 0,11 19,0 914,8 30,1 1,5 31,6 101,5 314,6 53,3 122,1 591,5 1.537,9 2001 865,0 6,4 1,6 0,11 18,5 891,6 24,3 1,0 25,3 83,3 304,9 47,7 123,7 559,6 1.476,4 2002 805,0 5,0 1,6 0,16 19,0 830,8 23,9 9,9 33,8 73,1 314,6 43,0 144,0 574,8 1.439,3 2003 770,0 5,5 (1) 0,16 22,0 797,7 27,2 10,0 37,2 75,1 342,9 37,5 150,0 605,6 1.473,4 2004 880,0 5,0 1,2 0,18 22,0 908,4 29,2 10,1 39,3 80,5 400,6 48,1 161,0 690,2 1.637,8 Fonte: ABIT e SINDITEXTIL (2005) (1) Indisponibili<strong>da</strong>de de informações 117
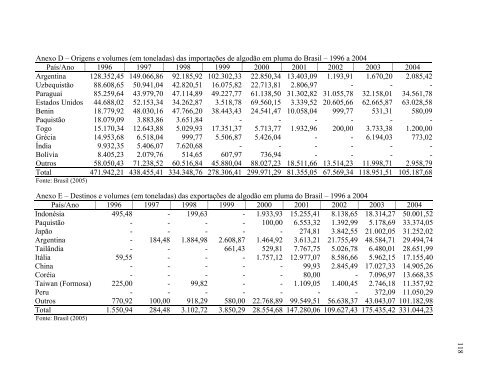
Anexo D – Origens e volumes (em tonela<strong>da</strong>s) <strong>da</strong>s importações de algodão em pluma do <strong>Brasil</strong> – 1996 a 2004 País/A<strong>no</strong> 1996 1997 1998 1999 2000 2001 2002 2003 2004 Argentina 128.352,45 149.066,86 92.185,92 102.302,33 22.850,34 13.403,09 1.193,91 1.670,20 2.085,42 Uzbequistão 88.608,65 50.941,04 42.820,51 16.075,82 22.713,81 2.806,97 - - - Paraguai 85.259,64 43.979,70 47.114,89 49.227,77 61.138,50 31.302,82 31.055,78 32.158,01 34.561,78 Estados Unidos 44.688,02 52.153,34 34.262,87 3.518,78 69.560,15 3.339,52 20.605,66 62.665,87 63.028,58 Benin 18.779,92 48.030,16 47.766,20 38.443,43 24.541,47 10.058,04 999,77 531,31 580,09 Paquistão 18.079,09 3.883,86 3.651,84 - - - - - - Togo 15.170,34 12.643,88 5.029,93 17.351,37 5.713,77 1.932,96 200,00 3.733,38 1.200,00 Grécia 14.953,68 6.518,04 999,77 5.506,87 5.426,04 - - 6.194,03 773,02 Índia 9.932,35 5.406,07 7.620,68 - - - - - - Bolívia 8.405,23 2.079,76 514,65 607,97 736,94 - - - - Outros 58.050,43 71.238,52 60.516,84 45.880,04 88.027,23 18.511,66 13.514,23 11.998,71 2.958,79 Total 471.942,21 438.455,41 334.348,76 278.306,41 299.971,29 81.355,05 67.569,34 118.951,51 105.187,68 Fonte: <strong>Brasil</strong> (2005) Anexo E – Desti<strong>no</strong>s e volumes (em tonela<strong>da</strong>s) <strong>da</strong>s exportações de algodão em pluma do <strong>Brasil</strong> – 1996 a 2004 País/A<strong>no</strong> 1996 1997 1998 1999 2000 2001 2002 2003 2004 Indonésia 495,48 - 199,63 - 1.933,93 15.255,41 8.138,65 18.314,27 50.001,52 Paquistão - - - - 100,00 6.553,32 1.392,99 5.178,69 33.374,05 Japão - - - - - 274,81 3.842,55 21.002,05 31.252,02 Argentina - 184,48 1.884,98 2.608,87 1.464,92 3.613,21 21.755,49 48.584,71 29.494,74 Tailândia - - - 661,43 529,81 7.767,75 5.026,78 6.480,01 28.651,99 Itália 59,55 - - - 1.757,12 12.977,07 8.586,66 5.962,15 17.155,40 China - - - - - 99,93 2.845,49 17.027,33 14.905,26 Coréia - - - - - 80,00 - 7.096,97 13.668,35 Taiwan (Formosa) 225,00 - 99,82 - - 1.109,05 1.400,45 2.746,18 11.357,92 Peru - - - - - - - 372,09 11.050,29 Outros 770,92 100,00 918,29 580,00 22.768,89 99.549,51 56.638,37 43.043,07 101.182,98 Total 1.550,94 284,48 3.102,72 3.850,29 28.554,68 147.280,06 109.627,43 175.435,42 331.044,23 Fonte: <strong>Brasil</strong> (2005) 118
- Page 1 and 2:
Universidade de São Paulo Escola S
- Page 4 and 5:
3 Para minha família: Lupércio, F
- Page 6 and 7:
SUMÁRIO RESUMO ...................
- Page 8 and 9:
RESUMO A reestruturação da cotoni
- Page 10 and 11:
LISTA DE FIGURAS Figura 1 - Evoluç
- Page 12 and 13:
LISTA DE TABELAS Tabela 1 - Alíquo
- Page 14 and 15:
1 INTRODUÇÃO 1.1 Considerações
- Page 16 and 17:
produção interna de algodão. Hou
- Page 18 and 19:
internas e externas (exportação).
- Page 20 and 21:
2 A REPRESENTATIVIDADE DO ALGODÃO
- Page 22 and 23:
A produção brasileira cresceu rap
- Page 24 and 25:
Mil t 3.900 3.600 3.300 3.000 2.700
- Page 26 and 27:
combater a inflação e seus sintom
- Page 28 and 29:
Mil t 3.750 3.500 3.250 3.000 2.750
- Page 30 and 31:
Figura 8 - Microrregiões produtora
- Page 32 and 33:
Mil t e ha 2.600 2.400 2.200 2.000
- Page 34 and 35:
4 MUDANÇAS INSTITUCIONAIS E DESEMP
- Page 36 and 37:
4.2 Ambiente institucional Nesta pa
- Page 38 and 39:
mudança na política agrícola fav
- Page 40 and 41:
da produção interna. Para IEL, CN
- Page 42 and 43:
Tabela 2 - Valor das importações
- Page 44 and 45:
importações foi influenciado pela
- Page 46 and 47:
acompanhando a evolução do setor
- Page 48 and 49:
Paraná, especificamente, apesar de
- Page 50 and 51:
empenho em superar vários problema
- Page 52 and 53:
do sistema. Estados e municípios p
- Page 54 and 55:
2001). É o caso dos programas esta
- Page 56 and 57:
esse é um dos pontos fundamentais
- Page 58 and 59:
Um dos problemas que o setor enfren
- Page 60 and 61:
4.6 Alguns apontamentos As análise
- Page 62 and 63:
5 REVISÃO BIBLIOGRÁFICA Vários t
- Page 64 and 65:
(desemprego): A solução do modelo
- Page 66 and 67:
as mesmas. Entretanto, agora a prod
- Page 68 and 69: crescimento do setor agrícola. Sha
- Page 70 and 71: sendo, d) choques de área colhida
- Page 72 and 73: A taxa de crescimento da oferta do
- Page 74 and 75: x x x e x 0 1 2 t = x = x = x 0 1 1
- Page 76 and 77: A 0 ⎡1 ⎢ ⎢ 0 = ⎢1 ⎢ ⎢0
- Page 78 and 79: suposição de que eles não têm c
- Page 80 and 81: ∆y t = Γ1 ∆y t−1 + ... + Γp
- Page 82 and 83: A área colhida com algodão aprese
- Page 84 and 85: Índice 240 220 200 180 160 140 120
- Page 86 and 87: que variáveis não estacionárias
- Page 88 and 89: Tabela 8 - Estimativa da matriz de
- Page 90 and 91: Entre as variáveis do modelo, só
- Page 92 and 93: Tabela 15 - Decomposição históri
- Page 94 and 95: Tabela 18 - Decomposição históri
- Page 96 and 97: Para as demais variáveis, observa-
- Page 98 and 99: Choque positivo de renda interna co
- Page 100 and 101: 9 CONSIDERAÇÕES FINAIS O objetivo
- Page 102 and 103: influenciada por variações margin
- Page 104 and 105: REFERÊNCIAS AGUIAR, D. Custo, risc
- Page 106 and 107: BARROS, J.R.M. de. Política e dese
- Page 108 and 109: DICKEY, D.A.; FULLER, W.A. Likeliho
- Page 110 and 111: INSTITUTO EUVALDO LODI - IEL; CONFE
- Page 112 and 113: MUELLER, C.C. Agricultura, desenvol
- Page 114 and 115: STEFANELO, E.L. Agronegócio brasil
- Page 116 and 117: Anexo A - Produção mundial de fib
- Page 120 and 121: Elasticidade acumulada 3,00 2,00 1,
- Page 122: Elasticidade acumulada 6,00 5,50 5,