A reestruturação da cotonicultura no Brasil - Cepea - USP
A reestruturação da cotonicultura no Brasil - Cepea - USP
A reestruturação da cotonicultura no Brasil - Cepea - USP

You also want an ePaper? Increase the reach of your titles
YUMPU automatically turns print PDFs into web optimized ePapers that Google loves.
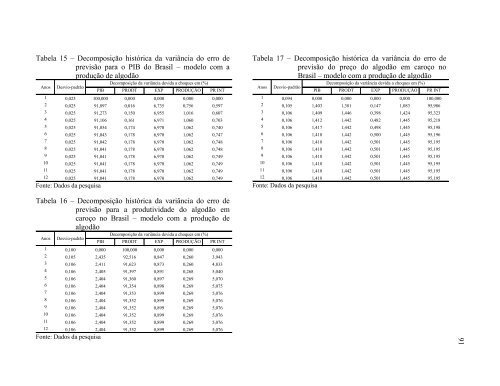
Tabela 15 – Decomposição histórica <strong>da</strong> variância do erro de<br />
previsão para o PIB do <strong>Brasil</strong> – modelo com a<br />
produção de algodão<br />
Decomposição <strong>da</strong> variância devi<strong>da</strong> a choques em (%)<br />
A<strong>no</strong>s Desvio-padrão<br />
PIB PRODT EXP PRODUÇÃO PR INT<br />
1 0,023 100,000 0,000 0,000 0,000 0,000<br />
2 0,025 91,897 0,016 6,735 0,756 0,597<br />
3 0,025 91,273 0,150 6,955 1,016 0,607<br />
4 0,025 91,106 0,161 6,971 1,060 0,703<br />
5 0,025 91,054 0,174 6,970 1,062 0,740<br />
6 0,025 91,043 0,178 6,970 1,062 0,747<br />
7 0,025 91,042 0,178 6,970 1,062 0,748<br />
8 0,025 91,041 0,178 6,970 1,062 0,748<br />
9 0,025 91,041 0,178 6,970 1,062 0,749<br />
10 0,025 91,041 0,178 6,970 1,062 0,749<br />
11 0,025 91,041 0,178 6,970 1,062 0,749<br />
12 0,025 91,041 0,178 6,970 1,062 0,749<br />
Fonte: Dados <strong>da</strong> pesquisa<br />
Tabela 16 – Decomposição histórica <strong>da</strong> variância do erro de<br />
previsão para a produtivi<strong>da</strong>de do algodão em<br />
caroço <strong>no</strong> <strong>Brasil</strong> – modelo com a produção de<br />
algodão<br />
Decomposição <strong>da</strong> variância devi<strong>da</strong> a choques em (%)<br />
A<strong>no</strong>s Desvio-padrão<br />
PIB PRODT EXP PRODUÇÃO PR INT<br />
1 0,100 0,000 100,000 0,000 0,000 0,000<br />
2 0,105 2,435 92,516 0,847 0,260 3,943<br />
3 0,106 2,411 91,623 0,873 0,260 4,833<br />
4 0,106 2,405 91,397 0,891 0,268 5,040<br />
5 0,106 2,404 91,360 0,897 0,269 5,070<br />
6 0,106 2,404 91,354 0,898 0,269 5,075<br />
7 0,106 2,404 91,353 0,899 0,269 5,076<br />
8 0,106 2,404 91,352 0,899 0,269 5,076<br />
9 0,106 2,404 91,352 0,899 0,269 5,076<br />
10 0,106 2,404 91,352 0,899 0,269 5,076<br />
11 0,106 2,404 91,352 0,899 0,269 5,076<br />
12 0,106 2,404 91,352 0,899 0,269 5,076<br />
Fonte: Dados <strong>da</strong> pesquisa<br />
Tabela 17 – Decomposição histórica <strong>da</strong> variância do erro de<br />
previsão do preço do algodão em caroço <strong>no</strong><br />
<strong>Brasil</strong> – modelo com a produção de algodão<br />
Decomposição <strong>da</strong> variância devi<strong>da</strong> a choques em (%)<br />
A<strong>no</strong>s Desvio-padrão<br />
PIB PRODT EXP PRODUÇÃO PR INT<br />
1 0,094 0,000 0,000 0,000 0,000 100,000<br />
2 0,105 1,403 1,381 0,147 1,083 95,986<br />
3 0,106 1,409 1,446 0,398 1,424 95,323<br />
4 0,106 1,412 1,442 0,482 1,445 95,218<br />
5 0,106 1,417 1,442 0,498 1,445 95,198<br />
6 0,106 1,418 1,442 0,500 1,445 95,196<br />
7 0,106 1,418 1,442 0,501 1,445 95,195<br />
8 0,106 1,418 1,442 0,501 1,445 95,195<br />
9 0,106 1,418 1,442 0,501 1,445 95,195<br />
10 0,106 1,418 1,442 0,501 1,445 95,195<br />
11 0,106 1,418 1,442 0,501 1,445 95,195<br />
12 0,106 1,418 1,442 0,501 1,445 95,195<br />
Fonte: Dados <strong>da</strong> pesquisa<br />
91