Elastici<strong>da</strong>de acumula<strong>da</strong> 3,00 2,00 1,00 0,00 -1,00 -2,00 -3,00 -4,00 -5,00 -6,00 -7,00 1 2 3 4 5 6 7 8 9 10 11 12 PIB PRODUTIVIDADE EXPORTAÇÃO ÁREA PR INTERNO Anexo F – Função de impulso resposta acumula<strong>da</strong> do PIB, <strong>da</strong> produtivi<strong>da</strong>de, <strong>da</strong> exportação, <strong>da</strong> área colhi<strong>da</strong> e do preço inter<strong>no</strong>, a impulso <strong>no</strong> PIB – modelo com a área colhi<strong>da</strong> Fonte: Dados <strong>da</strong> pesquisa Elastici<strong>da</strong>de acumula<strong>da</strong> 9,00 8,00 7,00 6,00 5,00 4,00 3,00 2,00 1,00 0,00 -1,00 1 2 3 4 5 6 7 8 9 10 11 12 PIB PRODUTIVIDADE EXPORTAÇÃO ÁREA PR INTERNO Anexo G – Função de impulso resposta acumula<strong>da</strong> do PIB, <strong>da</strong> produtivi<strong>da</strong>de, <strong>da</strong> exportação, <strong>da</strong> área colhi<strong>da</strong> e do preço inter<strong>no</strong>, a impulso na produtivi<strong>da</strong>de – modelo com a área colhi<strong>da</strong> Fonte: Dados <strong>da</strong> pesquisa Elastici<strong>da</strong>de acumula<strong>da</strong> 1,00 0,90 0,80 0,70 0,60 0,50 0,40 0,30 0,20 0,10 0,00 -0,10 1 2 3 4 5 6 7 8 9 10 11 12 PIB PRODUTIVIDADE EXPORTAÇÃO ÁREA PR INTERNO Anexo H – Função de impulso resposta acumula<strong>da</strong> do PIB, <strong>da</strong> produtivi<strong>da</strong>de, <strong>da</strong> exportação, <strong>da</strong> área colhi<strong>da</strong> e do preço inter<strong>no</strong>, a impulso na exportação – modelo com a área colhi<strong>da</strong> Fonte: Dados <strong>da</strong> pesquisa Elastici<strong>da</strong>de acumula<strong>da</strong> 6,00 5,50 5,00 4,50 4,00 3,50 3,00 2,50 2,00 1,50 1,00 0,50 0,00 -0,50 1 2 3 4 5 6 7 8 9 10 11 12 PIB PRODUTIVIDADE EXPORTAÇÃO ÁREA PR INTERNO Anexo I – Função de impulso resposta acumula<strong>da</strong> do PIB, <strong>da</strong> produtivi<strong>da</strong>de, <strong>da</strong> exportação, <strong>da</strong> área colhi<strong>da</strong> e do preço inter<strong>no</strong>, a impulso na área colhi<strong>da</strong> – modelo com a área colhi<strong>da</strong> Fonte: Dados <strong>da</strong> pesquisa 119
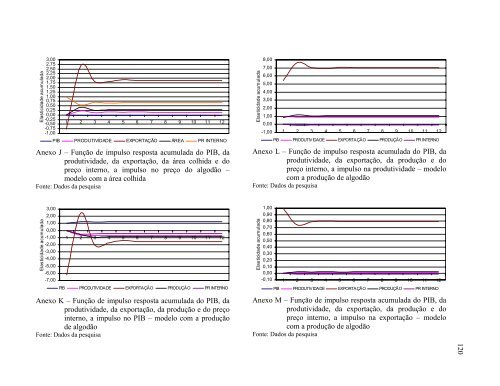
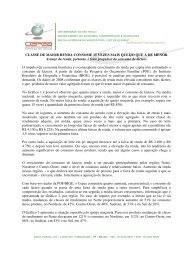
Elastici<strong>da</strong>de acumula<strong>da</strong> 3,00 2,75 2,50 2,25 2,00 1,75 1,50 1,25 1,00 0,75 0,50 0,25 0,00 -0,25 -0,50 -0,75 -1,00 1 2 3 4 5 6 7 8 9 10 11 12 PIB PRODUTIVIDADE EXPORTAÇÃO ÁREA PR INTERNO Anexo J – Função de impulso resposta acumula<strong>da</strong> do PIB, <strong>da</strong> produtivi<strong>da</strong>de, <strong>da</strong> exportação, <strong>da</strong> área colhi<strong>da</strong> e do preço inter<strong>no</strong>, a impulso <strong>no</strong> preço do algodão – modelo com a área colhi<strong>da</strong> Fonte: Dados <strong>da</strong> pesquisa Elastici<strong>da</strong>de acumula<strong>da</strong> 3,00 2,00 1,00 0,00 -1,00 -2,00 -3,00 -4,00 -5,00 -6,00 -7,00 1 2 3 4 5 6 7 8 9 10 11 12 PIB PRODUTIVIDADE EXPORTAÇÃO PRODUÇÃO PR INTERNO Anexo K – Função de impulso resposta acumula<strong>da</strong> do PIB, <strong>da</strong> produtivi<strong>da</strong>de, <strong>da</strong> exportação, <strong>da</strong> produção e do preço inter<strong>no</strong>, a impulso <strong>no</strong> PIB – modelo com a produção de algodão Fonte: Dados <strong>da</strong> pesquisa Elastici<strong>da</strong>de acumula<strong>da</strong> 8,00 7,00 6,00 5,00 4,00 3,00 2,00 1,00 0,00 -1,00 1 2 3 4 5 6 7 8 9 10 11 12 PIB PRODUTIVIDADE EXPORTA ÇÃO PRODUÇÃO PR INTERNO Anexo L – Função de impulso resposta acumula<strong>da</strong> do PIB, <strong>da</strong> produtivi<strong>da</strong>de, <strong>da</strong> exportação, <strong>da</strong> produção e do preço inter<strong>no</strong>, a impulso na produtivi<strong>da</strong>de – modelo com a produção de algodão Fonte: Dados <strong>da</strong> pesquisa Elastici<strong>da</strong>de acumula<strong>da</strong> 1,00 0,90 0,80 0,70 0,60 0,50 0,40 0,30 0,20 0,10 0,00 -0,10 1 2 3 4 5 6 7 8 9 10 11 12 PIB PRODUTIVIDADE EXPORTAÇÃO PRODUÇÃO PR INTERNO Anexo M – Função de impulso resposta acumula<strong>da</strong> do PIB, <strong>da</strong> produtivi<strong>da</strong>de, <strong>da</strong> exportação, <strong>da</strong> produção e do preço inter<strong>no</strong>, a impulso na exportação – modelo com a produção de algodão Fonte: Dados <strong>da</strong> pesquisa 120
- Page 1 and 2:
Universidade de São Paulo Escola S
- Page 4 and 5:
3 Para minha família: Lupércio, F
- Page 6 and 7:
SUMÁRIO RESUMO ...................
- Page 8 and 9:
RESUMO A reestruturação da cotoni
- Page 10 and 11:
LISTA DE FIGURAS Figura 1 - Evoluç
- Page 12 and 13:
LISTA DE TABELAS Tabela 1 - Alíquo
- Page 14 and 15:
1 INTRODUÇÃO 1.1 Considerações
- Page 16 and 17:
produção interna de algodão. Hou
- Page 18 and 19:
internas e externas (exportação).
- Page 20 and 21:
2 A REPRESENTATIVIDADE DO ALGODÃO
- Page 22 and 23:
A produção brasileira cresceu rap
- Page 24 and 25:
Mil t 3.900 3.600 3.300 3.000 2.700
- Page 26 and 27:
combater a inflação e seus sintom
- Page 28 and 29:
Mil t 3.750 3.500 3.250 3.000 2.750
- Page 30 and 31:
Figura 8 - Microrregiões produtora
- Page 32 and 33:
Mil t e ha 2.600 2.400 2.200 2.000
- Page 34 and 35:
4 MUDANÇAS INSTITUCIONAIS E DESEMP
- Page 36 and 37:
4.2 Ambiente institucional Nesta pa
- Page 38 and 39:
mudança na política agrícola fav
- Page 40 and 41:
da produção interna. Para IEL, CN
- Page 42 and 43:
Tabela 2 - Valor das importações
- Page 44 and 45:
importações foi influenciado pela
- Page 46 and 47:
acompanhando a evolução do setor
- Page 48 and 49:
Paraná, especificamente, apesar de
- Page 50 and 51:
empenho em superar vários problema
- Page 52 and 53:
do sistema. Estados e municípios p
- Page 54 and 55:
2001). É o caso dos programas esta
- Page 56 and 57:
esse é um dos pontos fundamentais
- Page 58 and 59:
Um dos problemas que o setor enfren
- Page 60 and 61:
4.6 Alguns apontamentos As análise
- Page 62 and 63:
5 REVISÃO BIBLIOGRÁFICA Vários t
- Page 64 and 65:
(desemprego): A solução do modelo
- Page 66 and 67:
as mesmas. Entretanto, agora a prod
- Page 68 and 69:
crescimento do setor agrícola. Sha
- Page 70 and 71: sendo, d) choques de área colhida
- Page 72 and 73: A taxa de crescimento da oferta do
- Page 74 and 75: x x x e x 0 1 2 t = x = x = x 0 1 1
- Page 76 and 77: A 0 ⎡1 ⎢ ⎢ 0 = ⎢1 ⎢ ⎢0
- Page 78 and 79: suposição de que eles não têm c
- Page 80 and 81: ∆y t = Γ1 ∆y t−1 + ... + Γp
- Page 82 and 83: A área colhida com algodão aprese
- Page 84 and 85: Índice 240 220 200 180 160 140 120
- Page 86 and 87: que variáveis não estacionárias
- Page 88 and 89: Tabela 8 - Estimativa da matriz de
- Page 90 and 91: Entre as variáveis do modelo, só
- Page 92 and 93: Tabela 15 - Decomposição históri
- Page 94 and 95: Tabela 18 - Decomposição históri
- Page 96 and 97: Para as demais variáveis, observa-
- Page 98 and 99: Choque positivo de renda interna co
- Page 100 and 101: 9 CONSIDERAÇÕES FINAIS O objetivo
- Page 102 and 103: influenciada por variações margin
- Page 104 and 105: REFERÊNCIAS AGUIAR, D. Custo, risc
- Page 106 and 107: BARROS, J.R.M. de. Política e dese
- Page 108 and 109: DICKEY, D.A.; FULLER, W.A. Likeliho
- Page 110 and 111: INSTITUTO EUVALDO LODI - IEL; CONFE
- Page 112 and 113: MUELLER, C.C. Agricultura, desenvol
- Page 114 and 115: STEFANELO, E.L. Agronegócio brasil
- Page 116 and 117: Anexo A - Produção mundial de fib
- Page 118 and 119: Anexo C - Consumo industrial de fib
- Page 122: Elasticidade acumulada 6,00 5,50 5,