A reestruturação da cotonicultura no Brasil - Cepea - USP
A reestruturação da cotonicultura no Brasil - Cepea - USP
A reestruturação da cotonicultura no Brasil - Cepea - USP

Create successful ePaper yourself
Turn your PDF publications into a flip-book with our unique Google optimized e-Paper software.
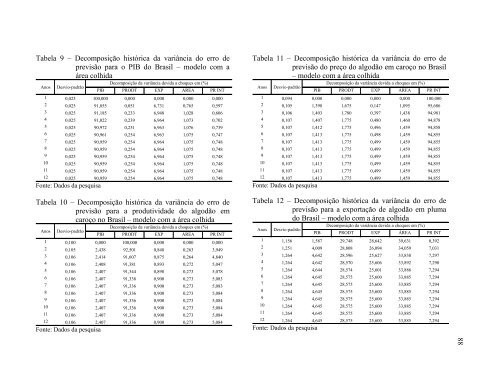
Tabela 9 – Decomposição histórica <strong>da</strong> variância do erro de<br />
previsão para o PIB do <strong>Brasil</strong> – modelo com a<br />
área colhi<strong>da</strong><br />
Decomposição <strong>da</strong> variância devi<strong>da</strong> a choques em (%)<br />
A<strong>no</strong>s Desvio-padrão<br />
PIB PRODT EXP ÁREA PR INT<br />
1 0,023 100,000 0,000 0,000 0,000 0,000<br />
2 0,025 91,855 0,051 6,731 0,765 0,597<br />
3 0,025 91,185 0,233 6,948 1,028 0,606<br />
4 0,025 91,022 0,239 6,964 1,073 0,702<br />
5 0,025 90,972 0,251 6,963 1,076 0,739<br />
6 0,025 90,961 0,254 6,963 1,075 0,747<br />
7 0,025 90,959 0,254 6,964 1,075 0,748<br />
8 0,025 90,959 0,254 6,964 1,075 0,748<br />
9 0,025 90,959 0,254 6,964 1,075 0,748<br />
10 0,025 90,959 0,254 6,964 1,075 0,748<br />
11 0,025 90,959 0,254 6,964 1,075 0,748<br />
12 0,025 90,959 0,254 6,964 1,075 0,748<br />
Fonte: Dados <strong>da</strong> pesquisa<br />
Tabela 10 – Decomposição histórica <strong>da</strong> variância do erro de<br />
previsão para a produtivi<strong>da</strong>de do algodão em<br />
caroço <strong>no</strong> <strong>Brasil</strong> – modelo com a área colhi<strong>da</strong><br />
Decomposição <strong>da</strong> variância devi<strong>da</strong> a choques em (%)<br />
A<strong>no</strong>s Desvio-padrão<br />
PIB PRODT EXP ÁREA PR INT<br />
1 0,100 0,000 100,000 0,000 0,000 0,000<br />
2 0,105 2,438 92,501 0,848 0,263 3,949<br />
3 0,106 2,414 91,607 0,875 0,264 4,840<br />
4 0,106 2,408 91,381 0,893 0,272 5,047<br />
5 0,106 2,407 91,344 0,898 0,273 5,078<br />
6 0,106 2,407 91,338 0,900 0,273 5,083<br />
7 0,106 2,407 91,336 0,900 0,273 5,083<br />
8 0,106 2,407 91,336 0,900 0,273 5,084<br />
9 0,106 2,407 91,336 0,900 0,273 5,084<br />
10 0,106 2,407 91,336 0,900 0,273 5,084<br />
11 0,106 2,407 91,336 0,900 0,273 5,084<br />
12 0,106 2,407 91,336 0,900 0,273 5,084<br />
Fonte: Dados <strong>da</strong> pesquisa<br />
Tabela 11 – Decomposição histórica <strong>da</strong> variância do erro de<br />
previsão do preço do algodão em caroço <strong>no</strong> <strong>Brasil</strong><br />
– modelo com a área colhi<strong>da</strong><br />
Decomposição <strong>da</strong> variância devi<strong>da</strong> a choques em (%)<br />
A<strong>no</strong>s Desvio-padrão<br />
PIB PRODT EXP ÁREA PR INT<br />
1 0,094 0,000 0,000 0,000 0,000 100,000<br />
2 0,105 1,398 1,675 0,147 1,095 95,686<br />
3 0,106 1,403 1,780 0,397 1,438 94,981<br />
4 0,107 1,407 1,775 0,480 1,460 94,878<br />
5 0,107 1,412 1,775 0,496 1,459 94,858<br />
6 0,107 1,413 1,775 0,498 1,459 94,855<br />
7 0,107 1,413 1,775 0,499 1,459 94,855<br />
8 0,107 1,413 1,775 0,499 1,459 94,855<br />
9 0,107 1,413 1,775 0,499 1,459 94,855<br />
10 0,107 1,413 1,775 0,499 1,459 94,855<br />
11 0,107 1,413 1,775 0,499 1,459 94,855<br />
12 0,107 1,413 1,775 0,499 1,459 94,855<br />
Fonte: Dados <strong>da</strong> pesquisa<br />
Tabela 12 – Decomposição histórica <strong>da</strong> variância do erro de<br />
previsão para a exportação de algodão em pluma<br />
do <strong>Brasil</strong> – modelo com a área colhi<strong>da</strong><br />
Decomposição <strong>da</strong> variância devi<strong>da</strong> a choques em (%)<br />
A<strong>no</strong>s Desvio-padrão<br />
PIB PRODT EXP ÁREA PR INT<br />
1 1,156 1,587 29,748 28,642 39,631 0,392<br />
2 1,251 4,009 28,808 26,094 34,059 7,031<br />
3 1,264 4,642 28,596 25,627 33,838 7,297<br />
4 1,264 4,642 28,570 25,606 33,892 7,290<br />
5 1,264 4,644 28,574 25,601 33,886 7,294<br />
6 1,264 4,645 28,575 25,600 33,885 7,294<br />
7 1,264 4,645 28,575 25,600 33,885 7,294<br />
8 1,264 4,645 28,575 25,600 33,885 7,294<br />
9 1,264 4,645 28,575 25,600 33,885 7,294<br />
10 1,264 4,645 28,575 25,600 33,885 7,294<br />
11 1,264 4,645 28,575 25,600 33,885 7,294<br />
12 1,264 4,645 28,575 25,600 33,885 7,294<br />
Fonte: Dados <strong>da</strong> pesquisa<br />
88